Study Designs/Foci Cohort & Cross-sectional
-1
archive,tax-study_designfocus,term-cohort-cross-sectional,term-85,wp-theme-stockholm,stockholm-core-1.2.2,select-theme-ver-9.0,ajax_fade,page_not_loaded,,qode_menu_center,wpb-js-composer js-comp-ver-6.3.0,vc_responsive

Microbiological and Chemical Contaminants in Single-Use and Multipackage Bottled Water: Inter- and Intra-analyses of 26 Bottled Water Brands in the USA
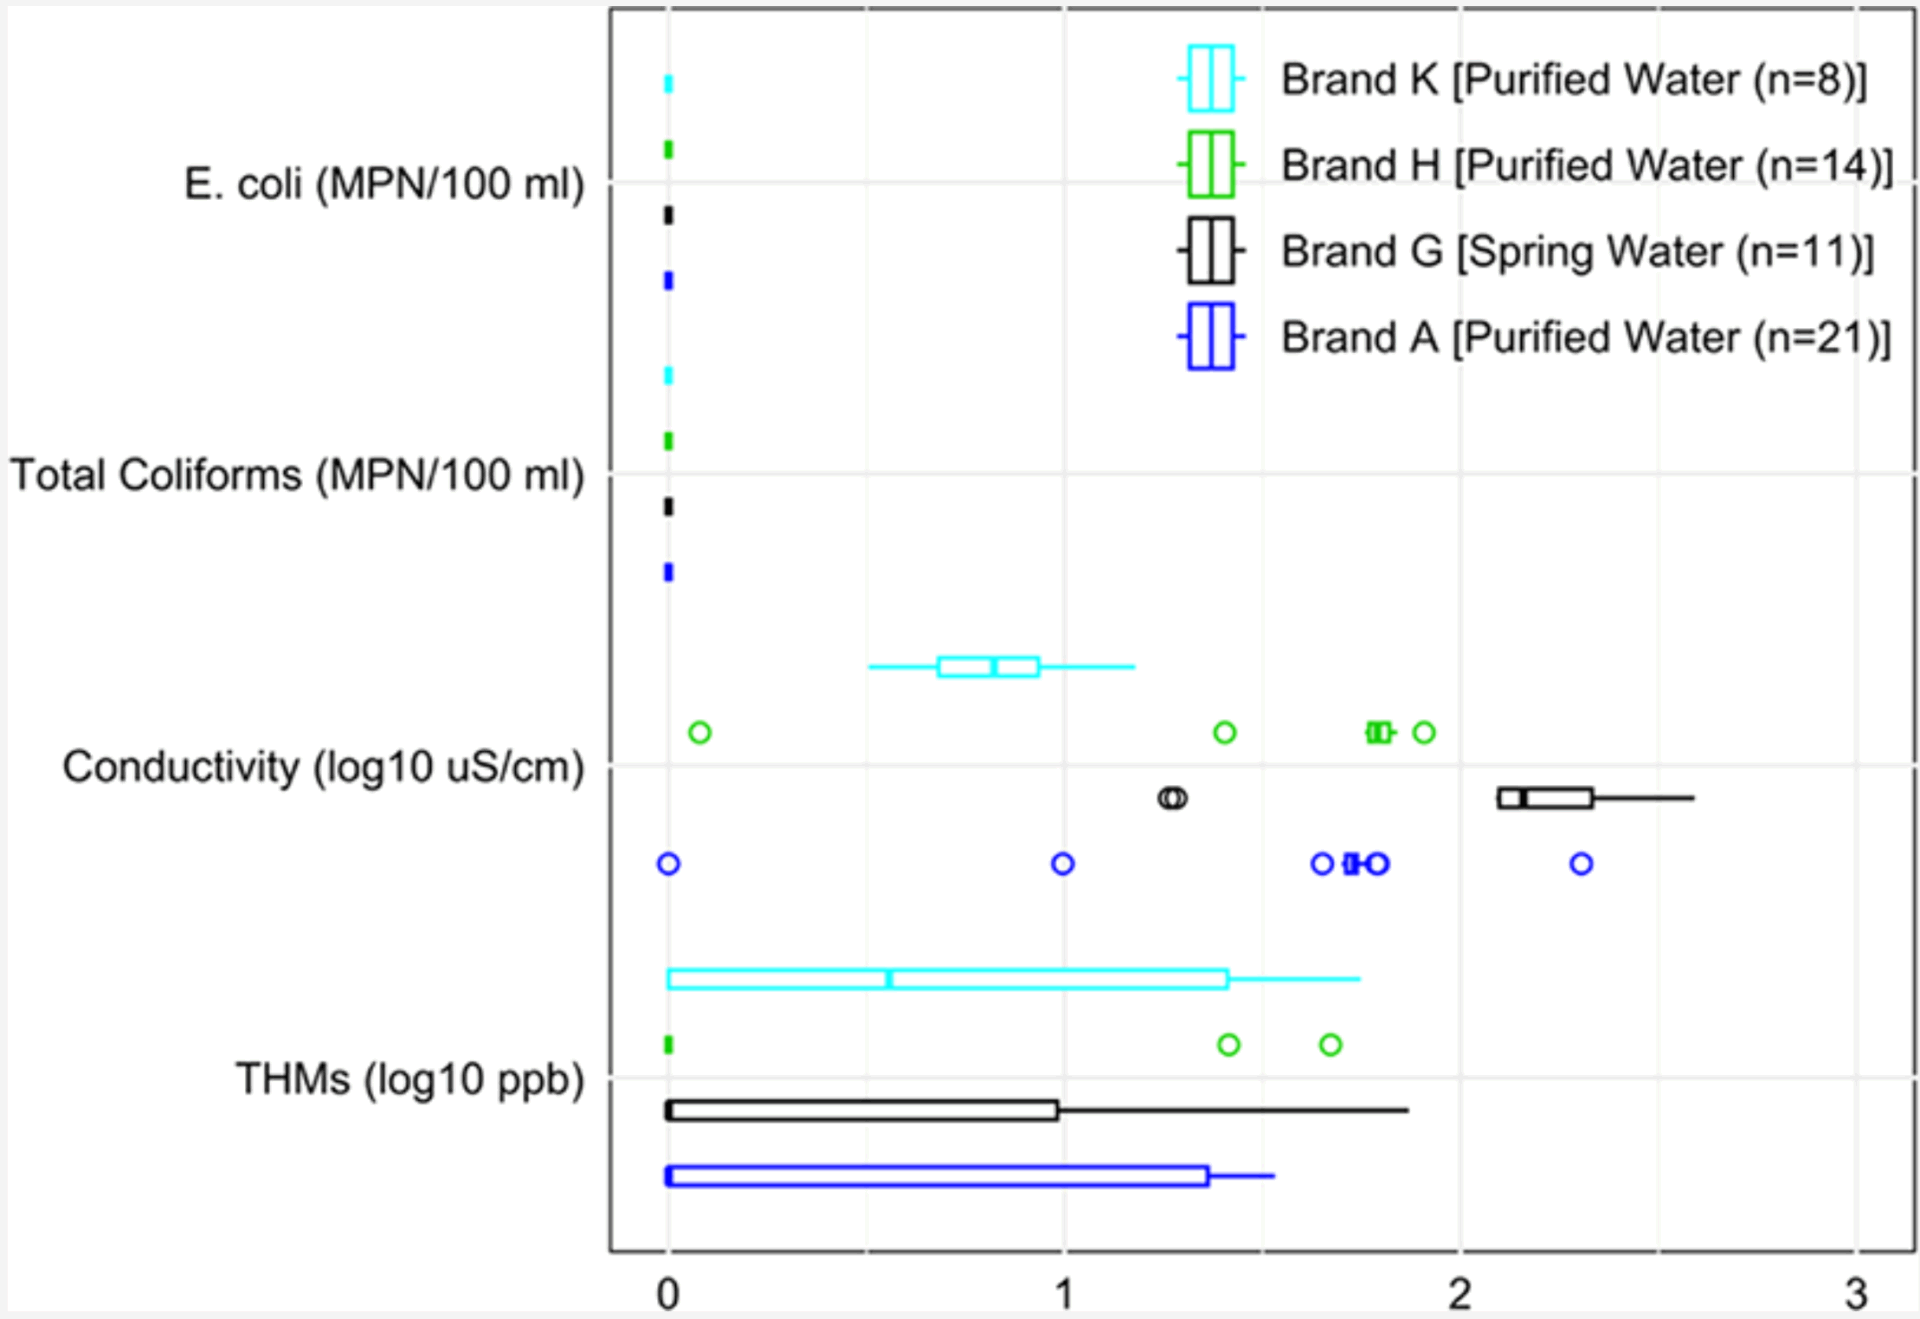
Relatively few published studies have assessed the microbiological or chemical quality of bottled water in the USA. We purchased all single and multipackage bottled water sold in grocery and retail stores in one county in Virginia. 107 samples, across 26 brands, were tested for pH, conductivity, dissolved oxygen, total coliform, E. coli, nitrate, sulfate, free chlorine, total trihalomethanes (THMs, a component of disinfection byproducts), fluoride, and heavy metals. 64.5% (n = 69) of samples were purified water and 35.5% (n = 38) were spring water. Contaminant concentrations were higher overall in spring water samples. Total coliforms and E. coli were not detected in any samples. 1.4% (n = 1) of purified bottled water samples exceeded regulatory standards for THM (80 ppb), and 7.2% (n = 5) and 10.5% (n = 4) of purified and spring samples exceeded 1/2 the THM standard, respectively. No spring water samples exceeded standards for heavy metals, but one purified bottled water sample exceeded the standard for cadmium. We observed considerable within-brand variability in concentrations for a number of parameters including THMs, calcium, silicon, and strontium. This is the first study we are aware of to analyze contaminant variability within bottled water brands. Our results indicate that monitoring and reporting requirements for bottled water should be improved.
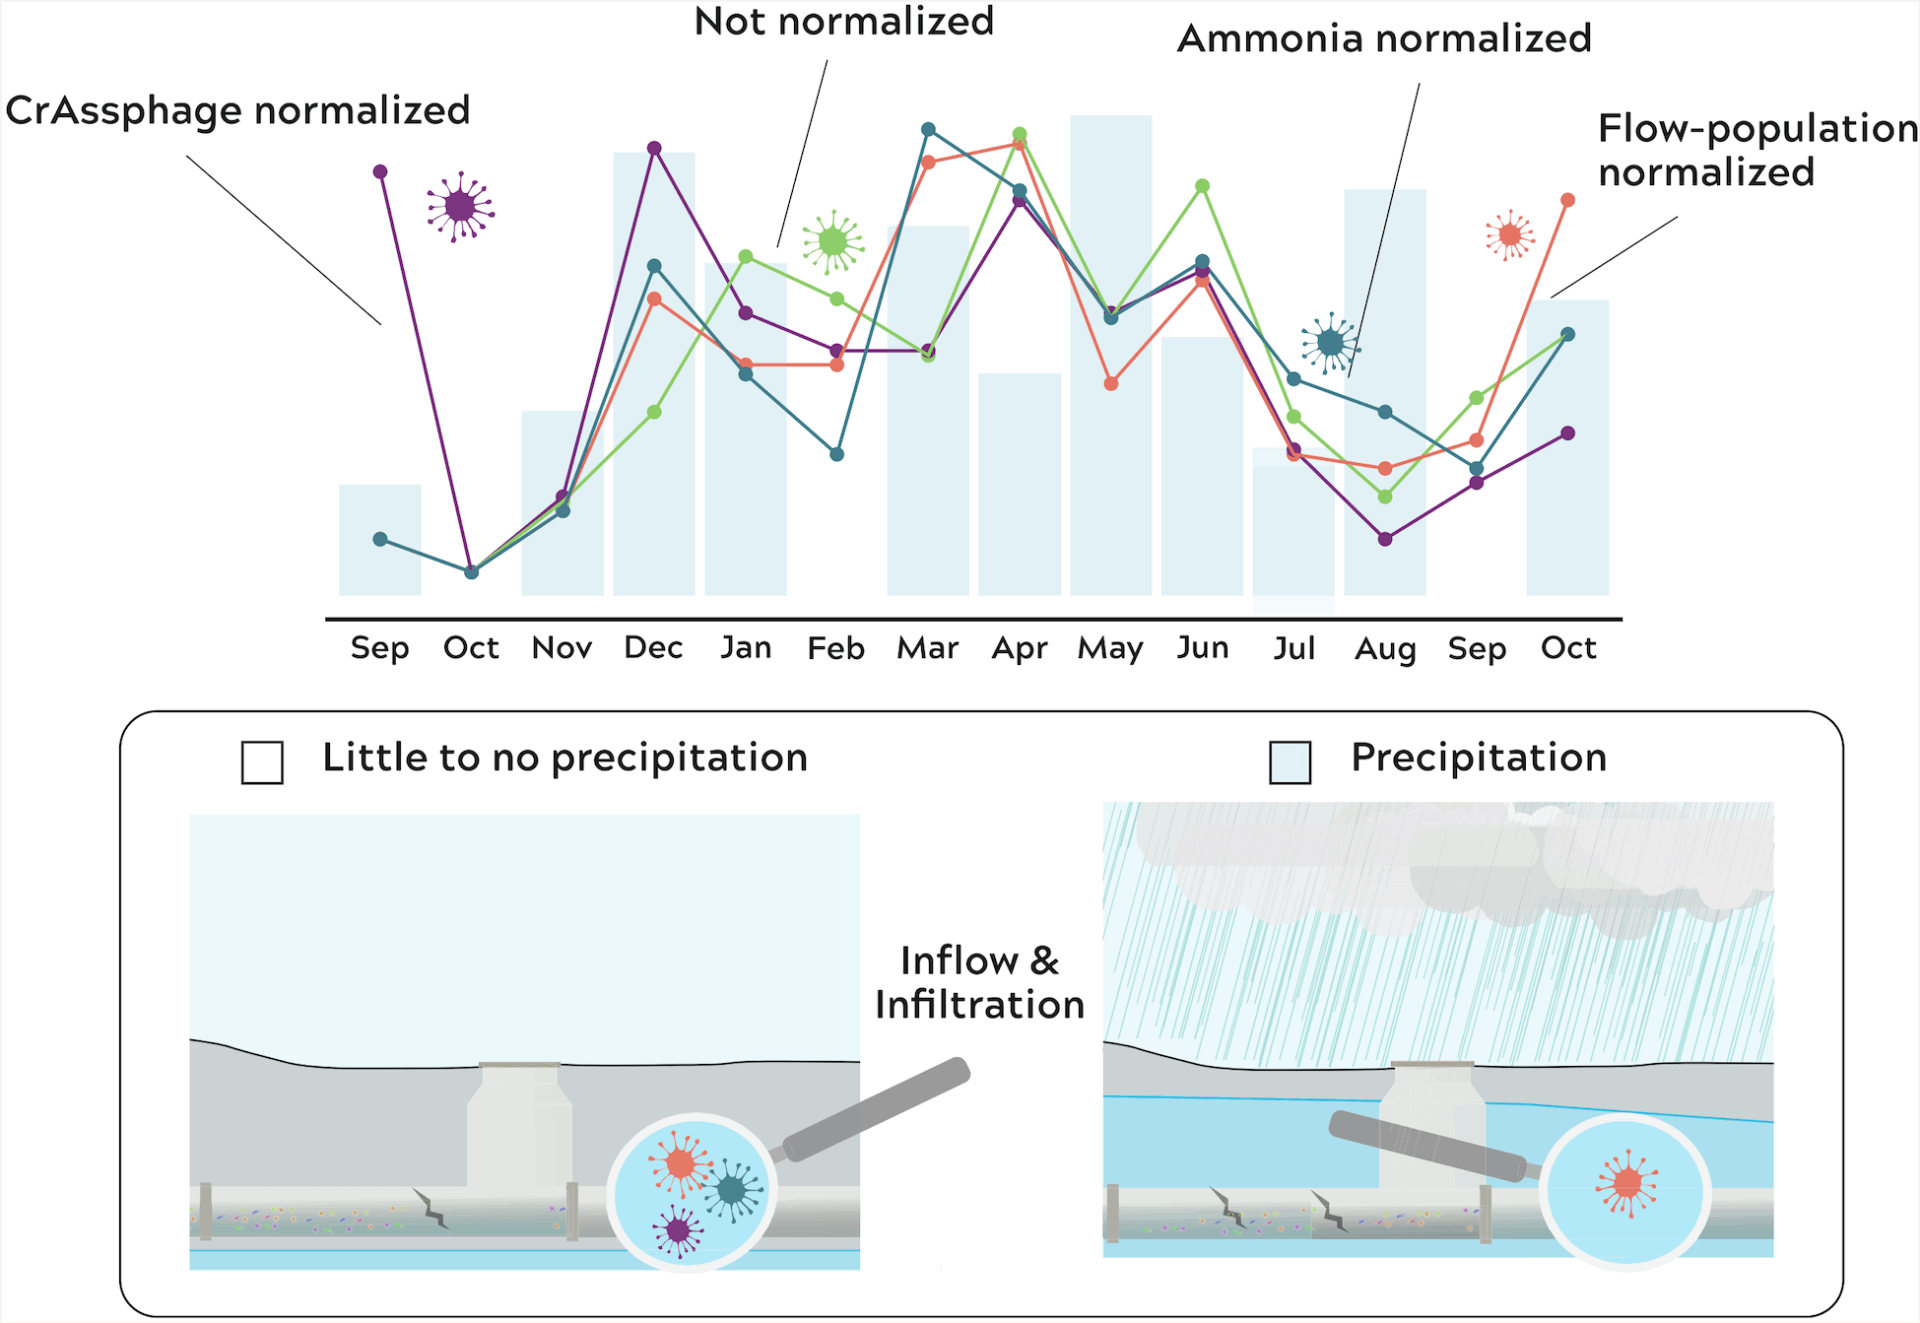
Comparative Assessment of Wastewater-Based Surveillance Normalization Methods to Improve Pathogen Monitoring in Rural Sewersheds

Many in-sewer dynamics that can impact the fidelity of wastewater-based surveillance results remain understudied. Some conventional approaches for normalizing pathogen signals in sewersheds may not be appropriate when there is substantial inflow and infiltration (I&I). Our objective for this study was to evaluate the effect of multiple normalization approaches on wastewater pathogen signals at the WWTP influent and across a small rural sewershed (<3000 people) with different levels of I&I. We collected wastewater samples monthly, from 2022 to 2023, from the wastewater treatment plant (WWTP) influent and 11 additional sewer system nodes with well-characterized I&I impacts. We quantified concentrations of SARS-CoV-2, norovirus GII, and rotavirus at the WWTP influent and subsewershed sites, and compared normalization approaches using flow, population, physicochemical parameters (COD, TSS, NH3(aq), PO43––P), and human fecal markers (crAssphage, HF183, mtDNA). Overall, our findings suggest that in systems with substantial I&I, some commonly used normalization approaches, particularly those using physicochemical parameters, may inadvertently introduce additional variability in viral signals measured at WWTP influent and result in wastewater measures that are more closely associated with precipitation trends rather than with pathogen signals. Normalization with human fecal markers appears to be a relatively robust option for sewersheds impacted by substantial I&I.

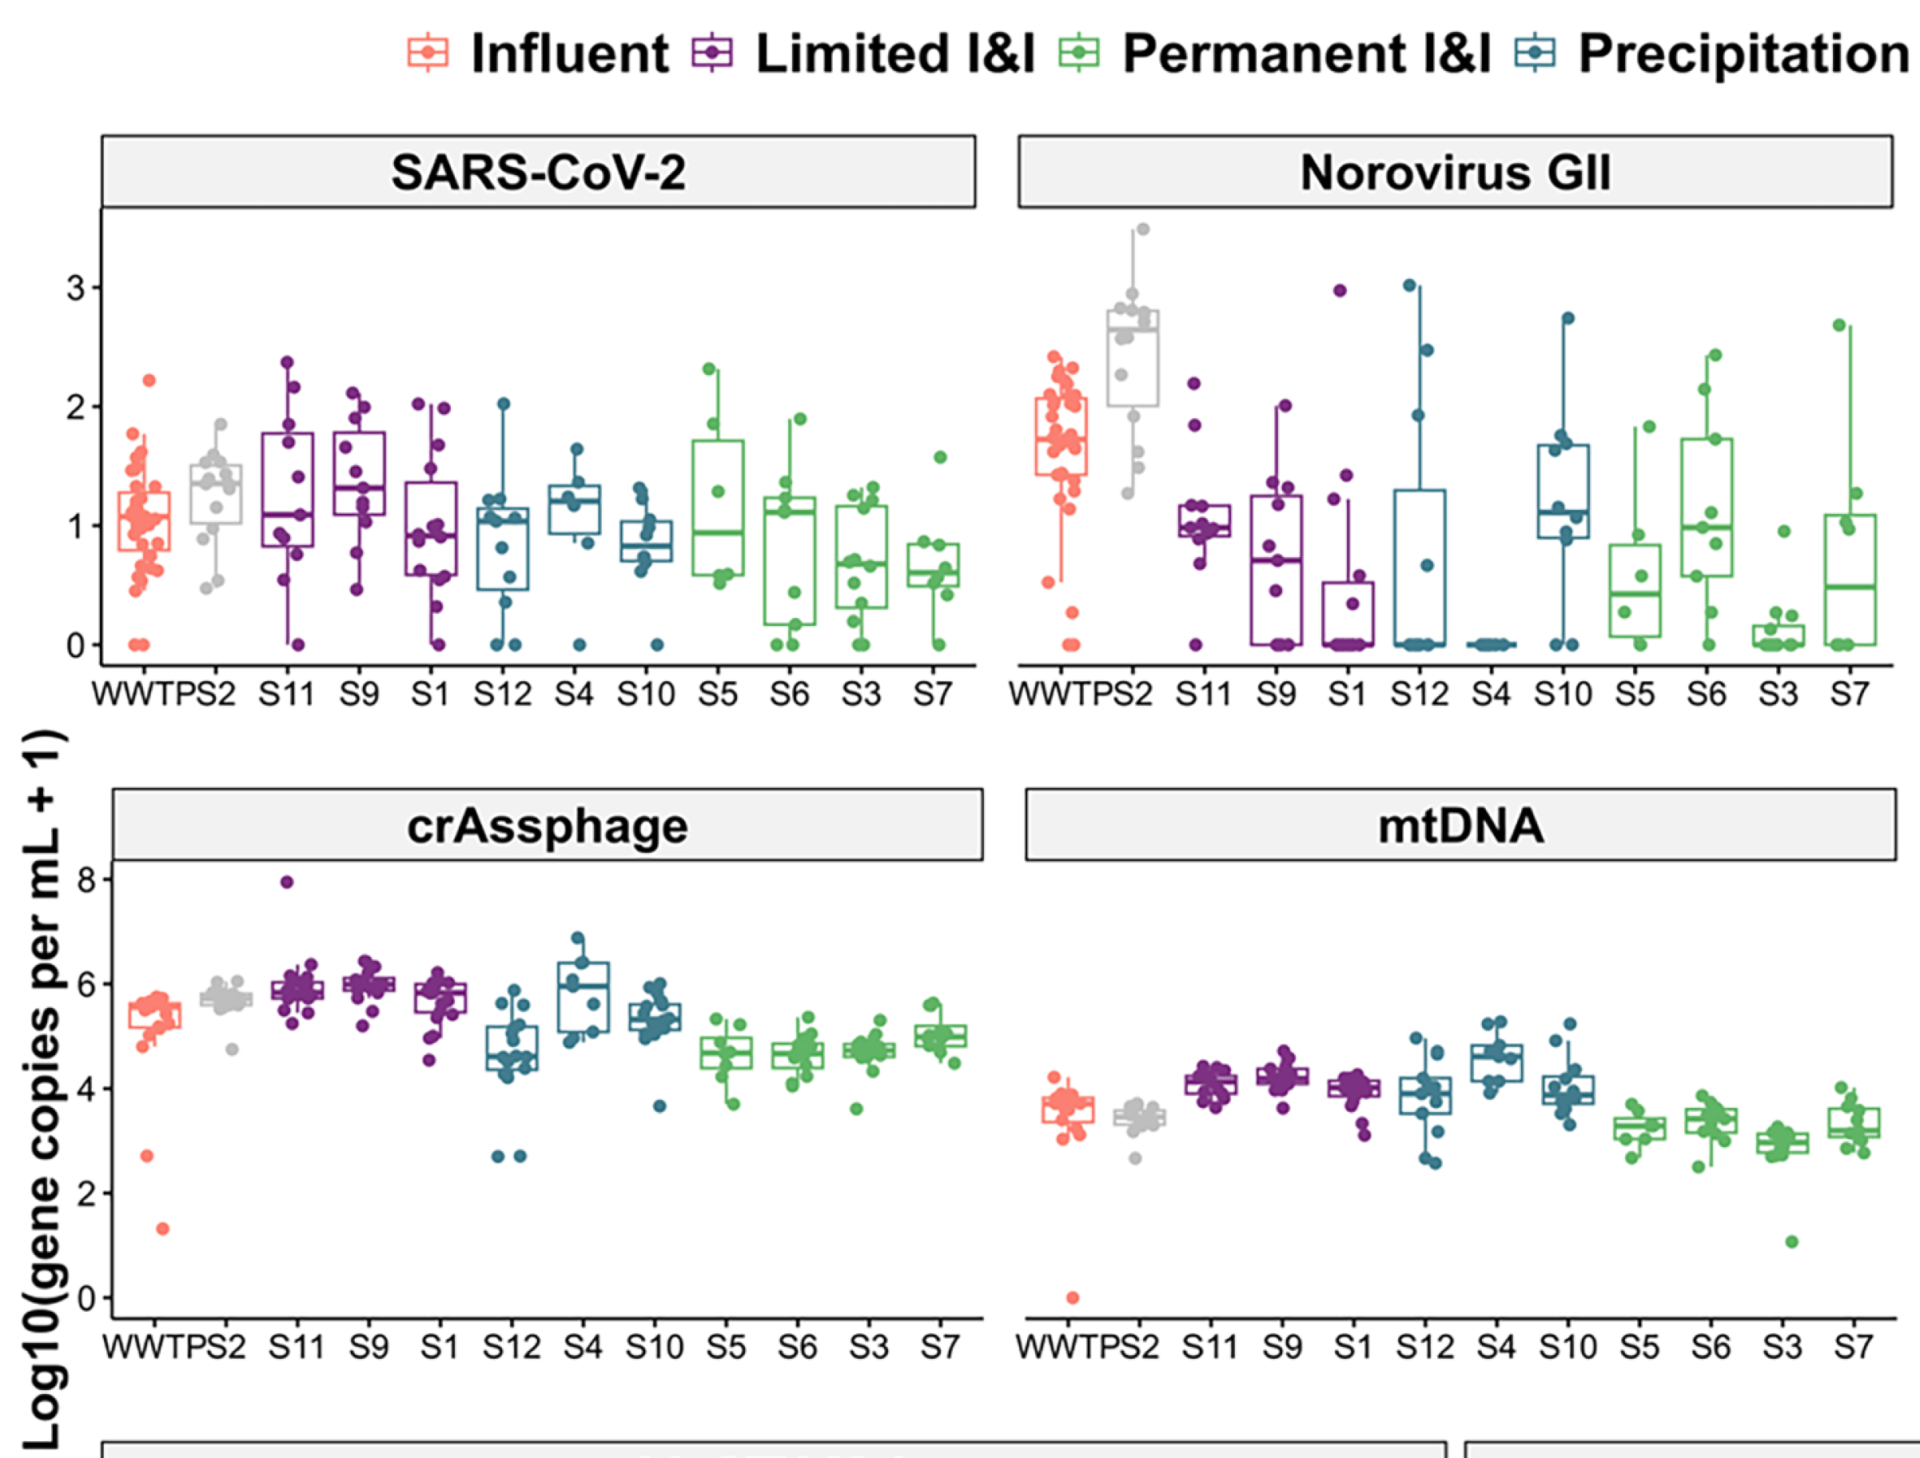
Subsewershed analyses of the impacts of inflow and infiltration on viral pathogens and antibiotic resistance markers across a rural sewer system

Abstract/Summary: As wastewater-based surveillance (WBS) is increasingly used to track community-level disease trends, it is important to understand how pathogen signals can be altered by phenomena that occur within sewersheds such as inflow and infiltration (I&I). Our objectives were to characterize I&I across a rural sewershed and assess potential impacts on viral (rotavirus, norovirus GII, and SARS-CoV-2), fecal indicator (HF183, the hCYTB484 gene specific to the human mitochondrial genome, and crAssphage), and antimicrobial resistance (intI1, blaCTX−M-1) targets. In a small town in Virginia (USA), we collected 107 wastewater samples at monthly intervals over a 12-month period (2022–2023) at the wastewater treatment plant (WWTP) influent and 11 up-sewer sites. Viral, fecal indicator, and antimicrobial resistance targets were enumerated using ddPCR. We observed the highest concentrations of human fecal markers and a measure anthropogenic pollution and antibiotic resistance (intI1) in up-sewer sites with limited I&I. However, median viral gene copy concentrations were highest at the WWTP, compared to 100 % (n = 11), 90 % (n = 10), and 55 % (n = 6) of up-sewer sites for rotavirus, norovirus GII, and SARS-CoV-2, respectively. After adjusting for covariates (Ba, COD, dissolved oxygen, groundwater depth, precipitation, sampling date) using generalized linear models, moderate to high I&I was associated with statistically significant reductions in log10-transformed rotavirus and norovirus GII concentrations across the sewershed (coefficients = -0.7 and -0.9, p < 0.001, n = 95), though not for SARS-CoV-2 (coefficient = -0.2, p = 0.181, n = 95). Overall, we found that while I&I can diminish biomarker signals throughout a sewershed, including at the WWTP influent, I&I impacts vary depending on the target, and pathogen biomarker signals were, on average, higher and less variable over time at the WWTP compared to most up-sewer sites. As far as we are aware, this is the first study to assess in situ I&I impacts on multiple WBS targets. Taken together, our findings highlight challenges and tradeoffs associated with different sampling strategies for different WBS targets in heavily I&I impacted systems.

Point-of-use chlorine residuals and disinfection byproduct occurrences in rural households served by public water utilities in Appalachian Virginia

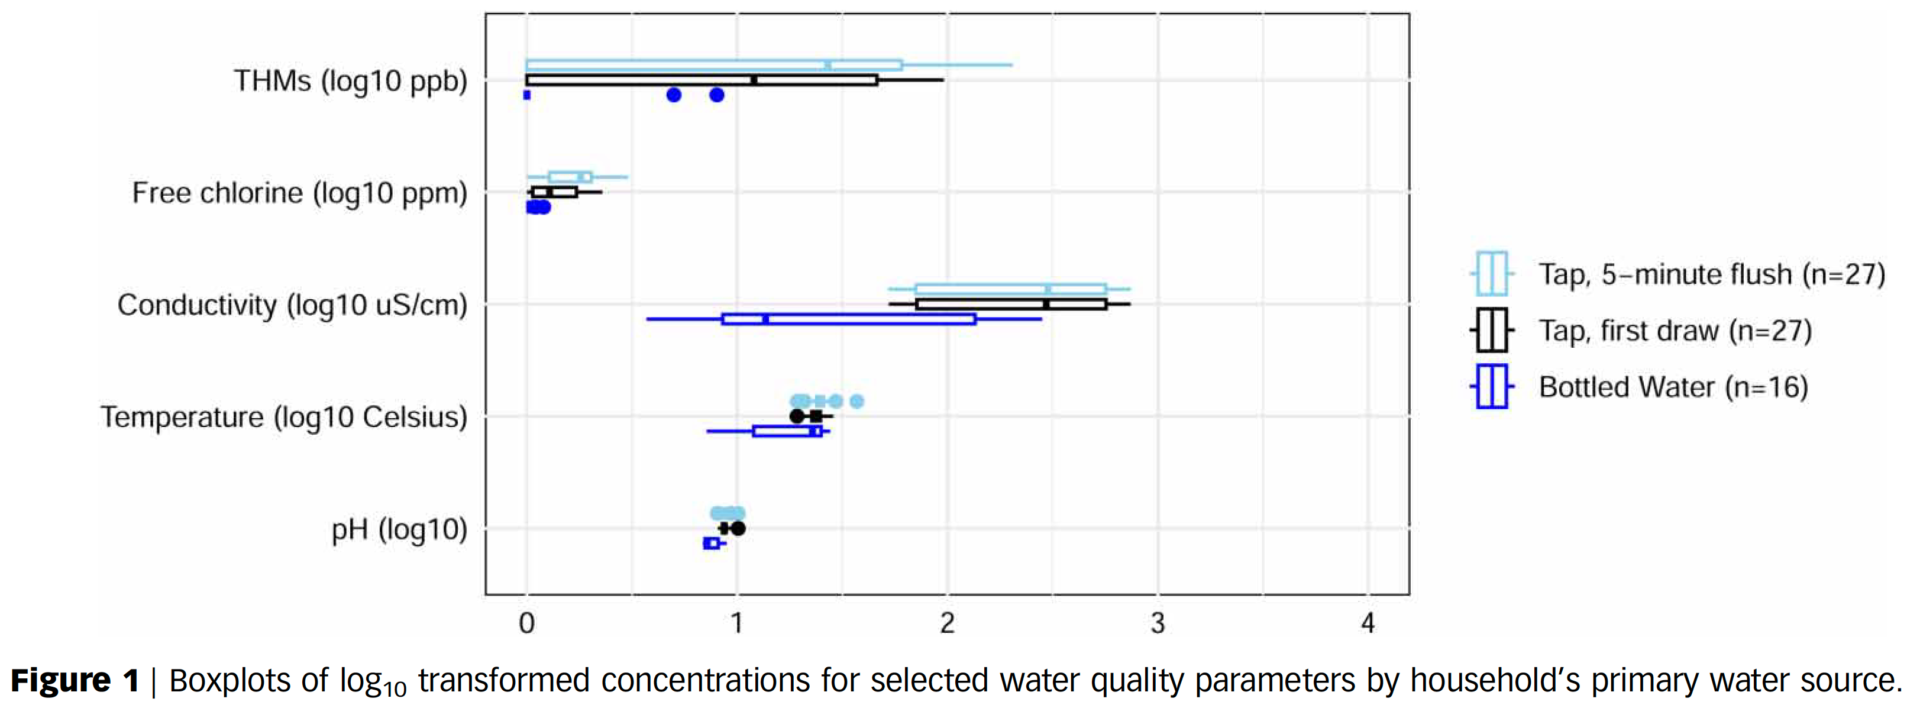
Abstract/Summary: We characterized concentrations of trihalomethanes (THMs), a measure of disinfection byproducts (DBPs), in tap water samples collected from households with utility-supplied water in two rural counties in Appalachian Virginia, and assessed associations with pH, free chlorine, and metal ions which can impact THM formation. Free chlorine concentrations in all samples (n = 27 homes) complied with EPA drinking water guidelines, though 7% (n = 2) of first draw samples and 11% (n = 3) of 5-min flushed-tap water samples exceeded the US Safe Drinking Water Act (SDWA) maximum contaminant level (MCL) for THM (80 ppb). Regression analyses showed that free chlorine and pH were positively associated with the formation of THM levels above SDWA MCLs (OR = 1.04, p = 0.97 and OR = 1.74, p = 0.79, respectively), while temperature was negatively associated (OR = 0.78, p = 0.38). Of the eight utilities serving study households, samples from water served by three different utilities exceeded the EPA MCL for THM. Overall, these findings do not indicate substantial exposures to DBPs for rural households with utility-supplied water in this region of southwest Virginia. However, given the observed variability in THM concentrations between and across utilities, and established adverse health impacts associated with chronic and acute DBP exposure, more research on DBPs in rural Central Appalachia is warranted.

Drinking water sources, quality, and associated health outcomes in Appalachian Virginia: A risk characterization study in two counties

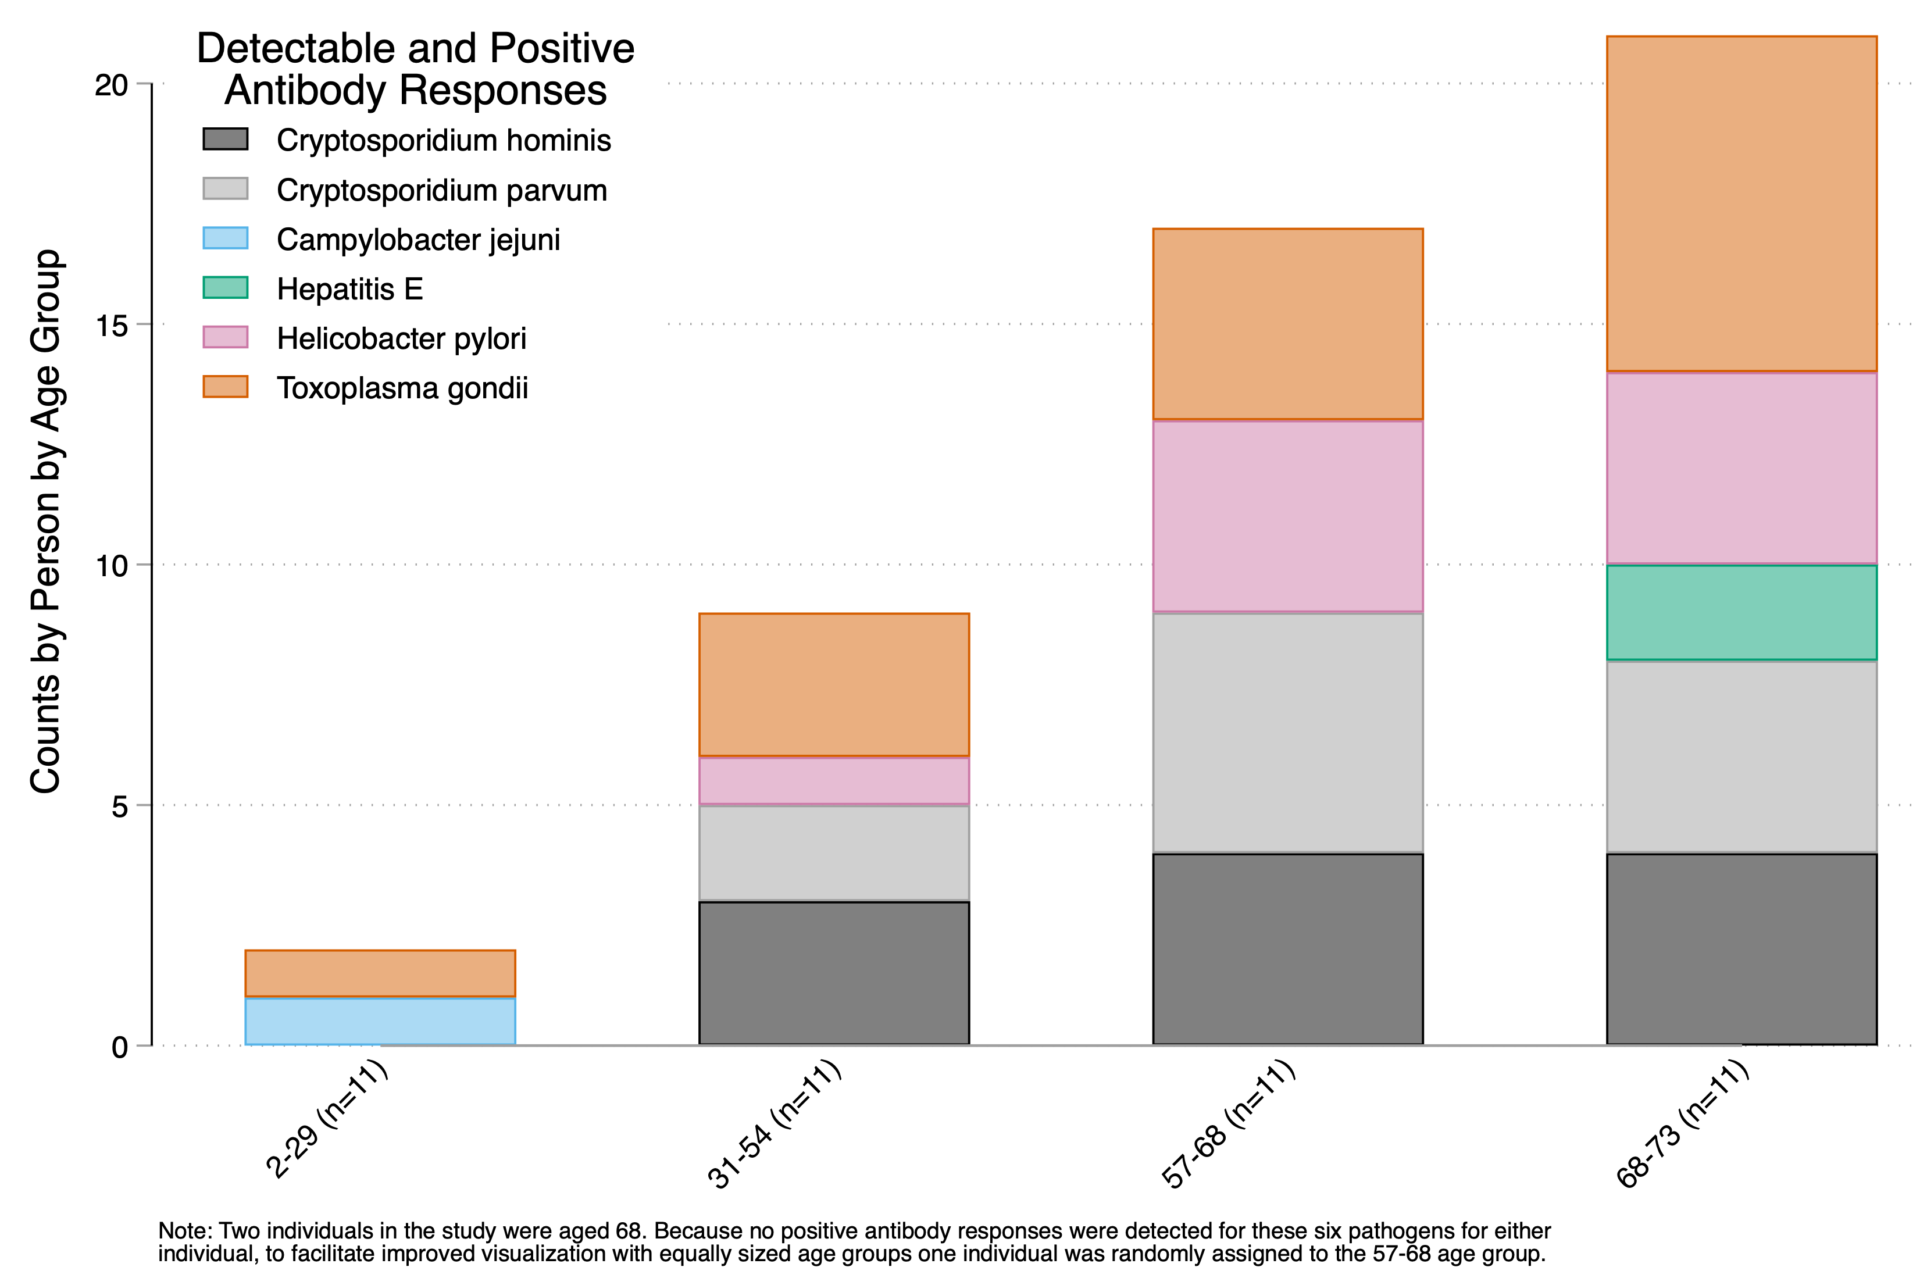
Abstract/Summary: In the US, violations of drinking water regulations are highest in lower-income rural areas overall, and particularly in Central Appalachia. However, data on drinking water use, quality, and associated health outcomes in rural Appalachia are limited. We sought to assess public and private drinking water sources and associated risk factors for waterborne pathogen exposures for individuals living in rural regions of Appalachian Virginia. We administered surveys and collected tap water, bottled water, and saliva samples in lower-income households in two adjacent rural counties in southwest Virginia (bordering Kentucky and Tennessee). Water samples were tested for pH, temperature, conductivity, total coliforms, E. coli, free chlorine, nitrate, fluoride, heavy metals, and specific pathogen targets. Saliva samples were analyzed for antibody responses to potentially waterborne infections. We also shared water analysis results with households. We enrolled 33 households (83 individuals), 82% (n = 27) with utility-supplied water and 18% with private wells (n = 3) or springs (n = 3). 58% (n = 19) reported household incomes of <$20,000/year. Total coliforms were detected in water samples from 33% (n = 11) of homes, E. coli in 12%, all with wells or springs (n = 4), and Aeromonas, Campylobacter, and Enterobacter in 9%, all spring water (n = 3). Diarrhea was reported for 10% of individuals (n = 8), but was not associated with E. coli detection. 34% (n = 15) of saliva samples had detectable antibody responses for Cryptosporidium spp., C. jejuni, and Hepatitis E. After controlling for covariates and clustering, individuals in households with septic systems and straight pipes had significantly higher likelihoods of antibody detection (risk ratios = 3.28, 95%CI = 1.01–10.65). To our knowledge, this is the first study to collect and analyze drinking water samples, saliva samples, and reported health outcome data from low-income households in Central Appalachia. Our findings indicate that utility-supplied water in this region was generally safe, and individuals in low-income households without utility-supplied water or sewerage have higher exposures to waterborne pathogens.

Climate information access and use in East and Southern Africa: identifying linkages between smallholder household characteristics and climate change adaptation

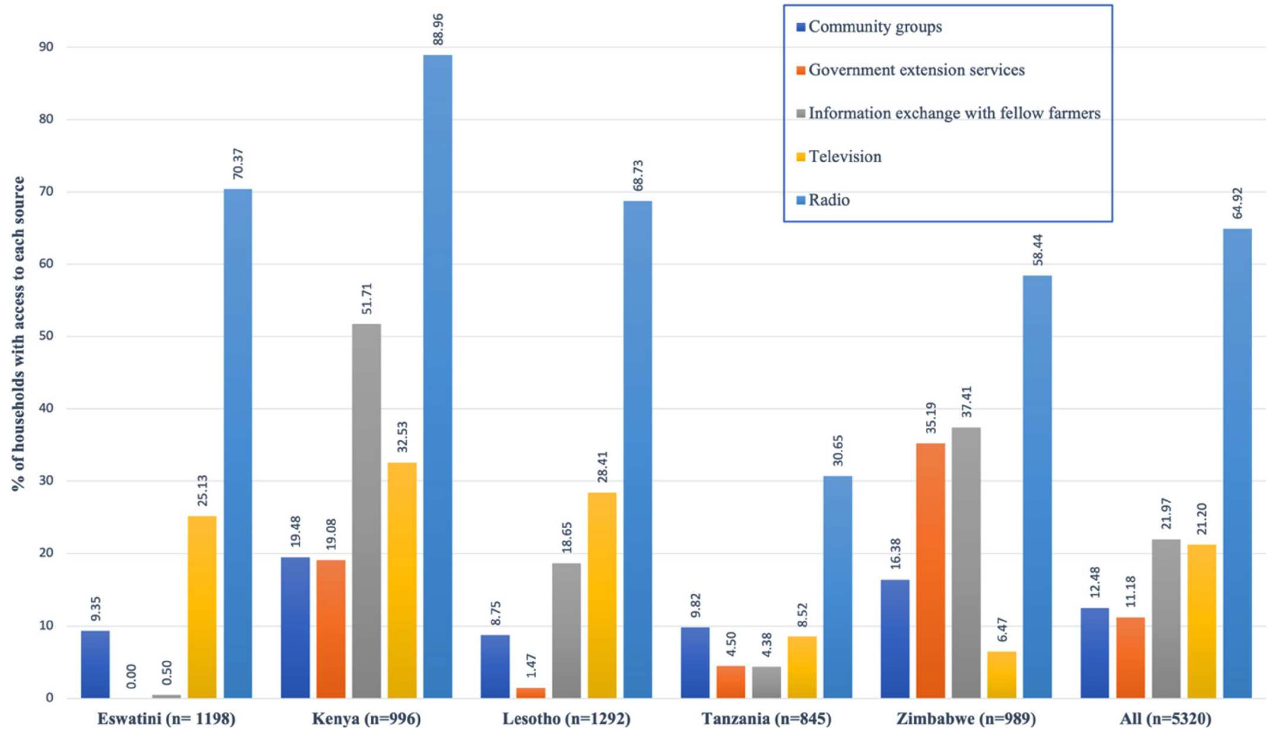
Abstract/Summary: Climate change adversely impacts the livelihoods of smallholder farmers across East and Southern Africa. Climate-related information is assumed to support smallholder farmer decision-making and use of adaptive practices as a means to improve livelihoods, resiliency and levels of food security. However, the value of climate information provision and its role in promoting adaptive practices remains poorly understood. We examined smallholder household access to, and use of, climate information. Survey data was collected from 5322 households across Eswatini, Kenya, Lesotho, Tanzania and Zimbabwe using the Multidimensional Poverty Assessment Tool. Overall, the majority of households regularly accessed at least one source of climate information, primarily via radio (64.9%, n = 3453). Our statistical models showed that households with relatively better access to credit and land tenure were more likely to receive climate information (p < 0.01 and p < 0.001, respectively, n = 1421), and of those, households who reported observing past climate-related changes were more likely to actually use climate information (p < 0.05, n = 1097). Secure land tenure was positively associated with information use, though not statistically significant. Findings from our study offer guidance for improving the targeting and delivery of climate information programmes and policies, and indicate that the assumed benefits of climate information provision should be more rigorously evaluated.

Perceptions of poverty: Evaluating Multidimensional Poverty Assessment Tool derived rankings and global development indicators in five African nations

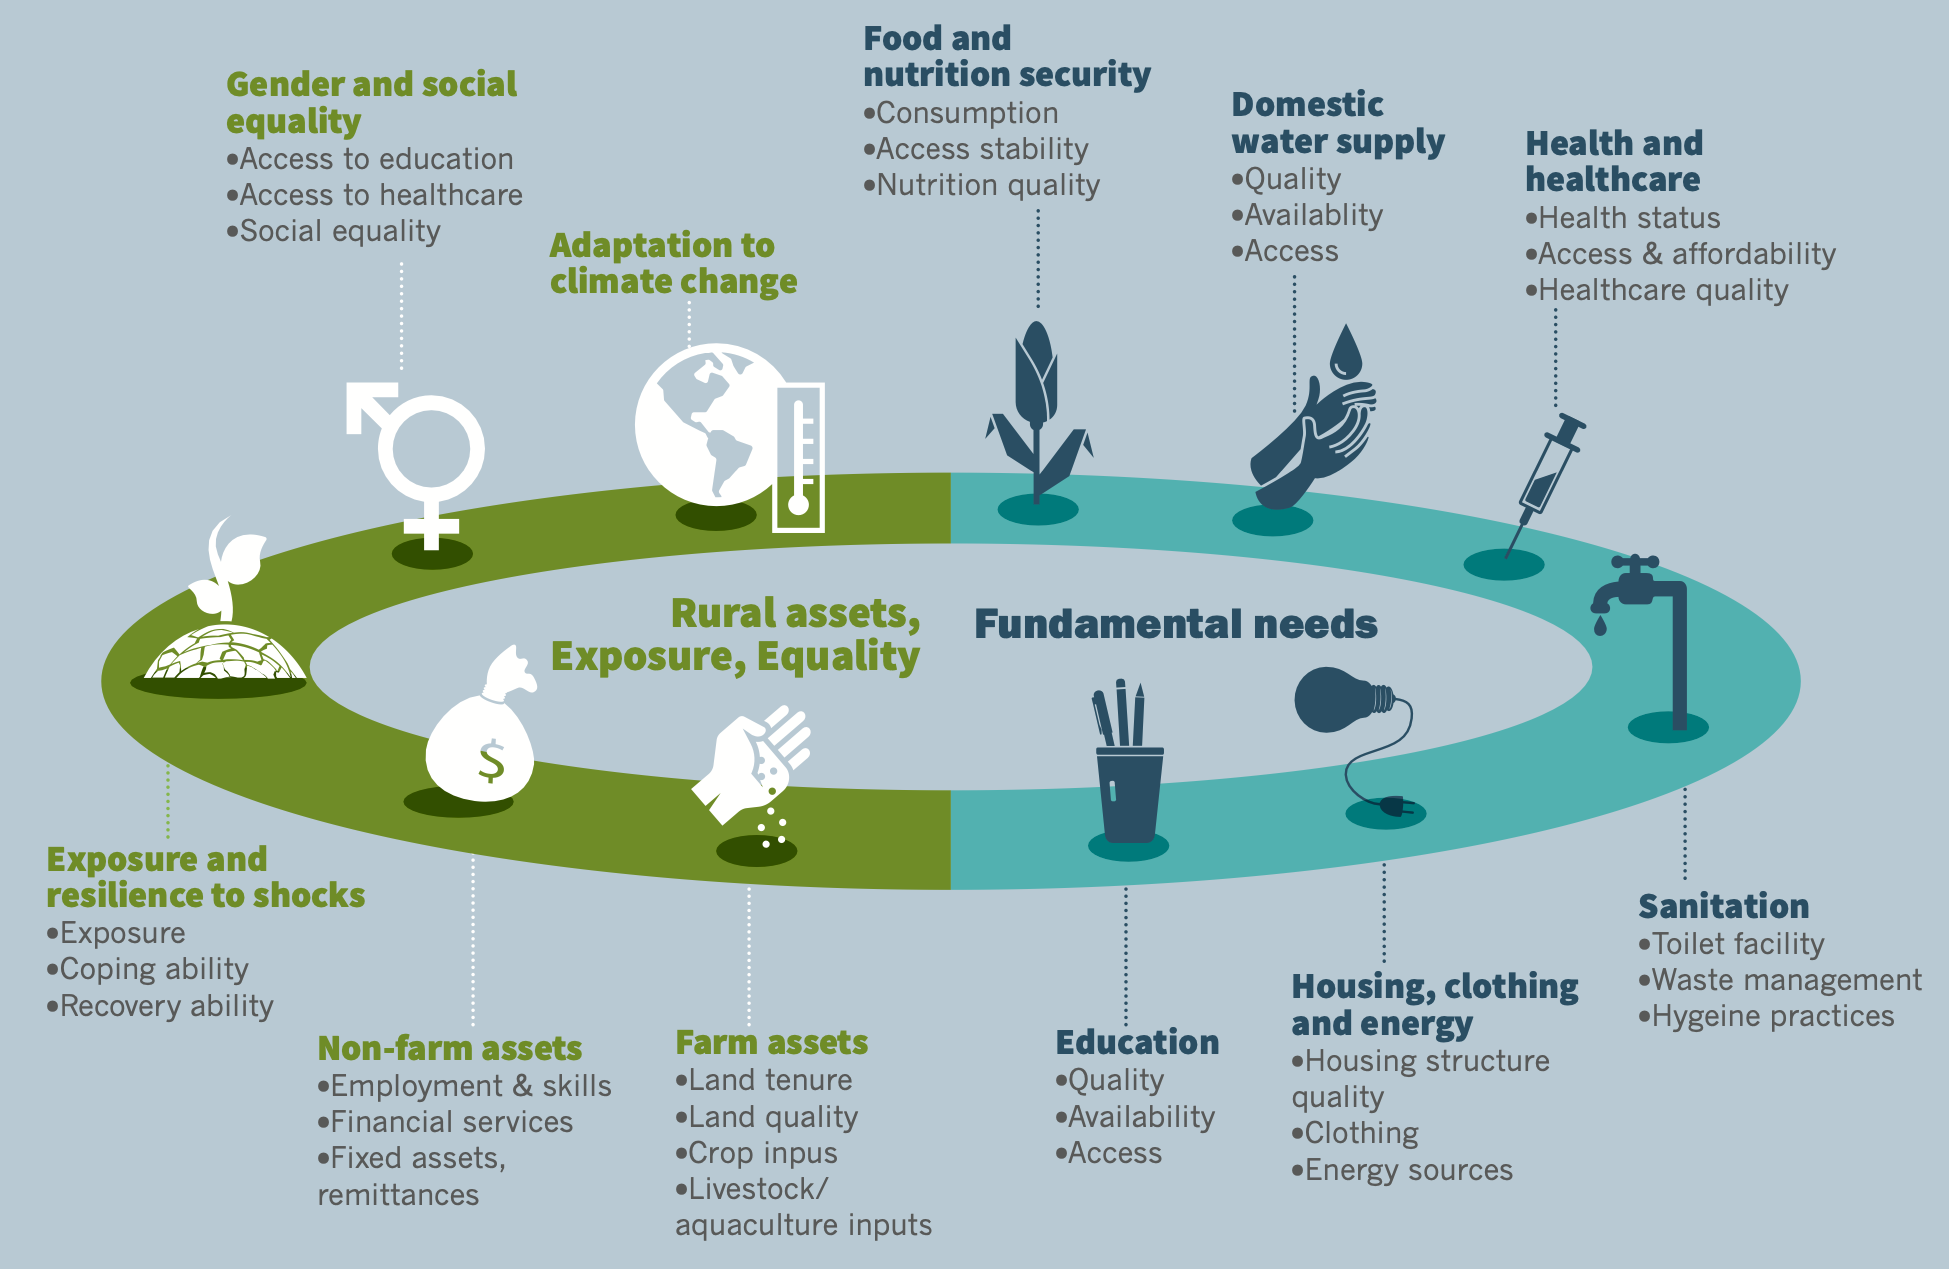
Abstract/Summary: This study assessed an array of indicators for rural poverty assessments and evaluated use of the Multidimensional Poverty Assessment Tool (MPAT) as a proxy for commonly used indicators, such as the Human Development Index, Gross National Income, Global Hunger Index, and the Gender Inequality Index. MPAT data from 5322 rural households across five countries in Africa were analyzed. While MPAT aligned well with development indicators for Kenya, Lesotho, and Tanzania, this was not the case for Eswatini and Zimbabwe. Overall, MPAT-based rankings correlated well with hunger, food security, and gender equality indicators. Our findings highlight the use of MPAT-derived indices as valuable supplements for commonly used development indicators.

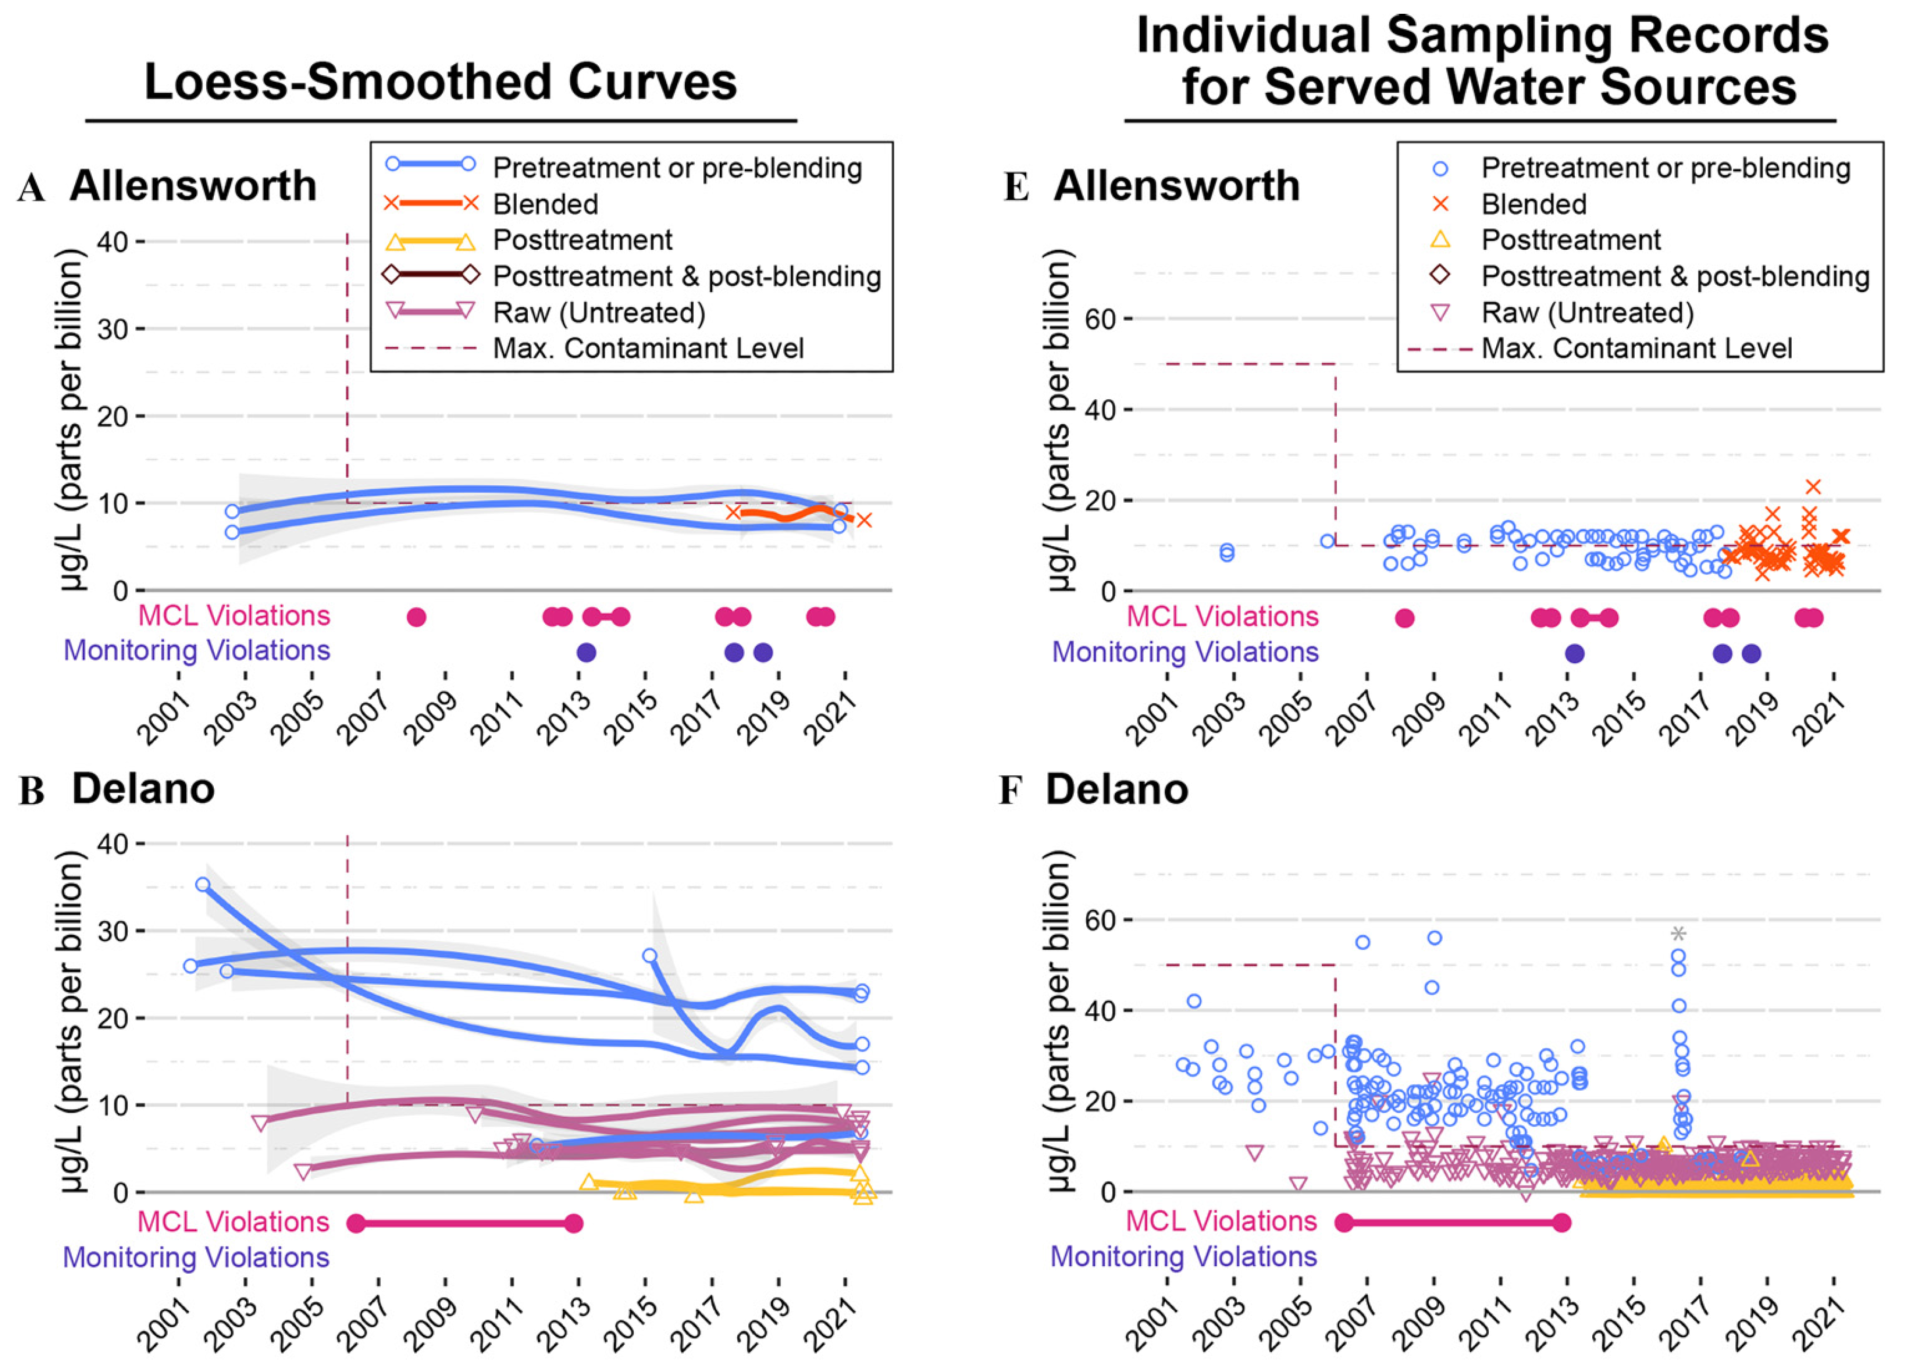
The Human Right to Water: A 20-Year Comparative Analysis of Arsenic in Rural and Carceral Drinking Water Systems in California

Abstract/Summary: Access to safe drinking water is considered a universal human right. In the U.S., exposure to arsenic contamination in drinking water disproportionately impacts small, groundwater-reliant communities and communities of color. Limited research exists on water quality in prisons; however, prisons in the Southwestern U.S. have elevated arsenic concentrations compared to other community water systems (CWS) in the region. In this paper we present a comparative analysis of 20 years of data (2001-2021) on arsenic concentrations in the CWSs serving Kern Valley State Prison (KVSP) and three neighboring rural communities: Allensworth, Delano, and McFarland. Our objective was to better understand trends in water quality, compliance, and treatment following adoption of the revised arsenic MCL, and to elucidate differences, if any, between neighboring incarcerated and non-incarcerated populations.

Bottled and Well Water Quality in a Small Central Appalachian Community: Household-Level Analysis of Enteric Pathogens, Inorganic Chemicals, and Health Outcomes in Rural Southwest Virginia

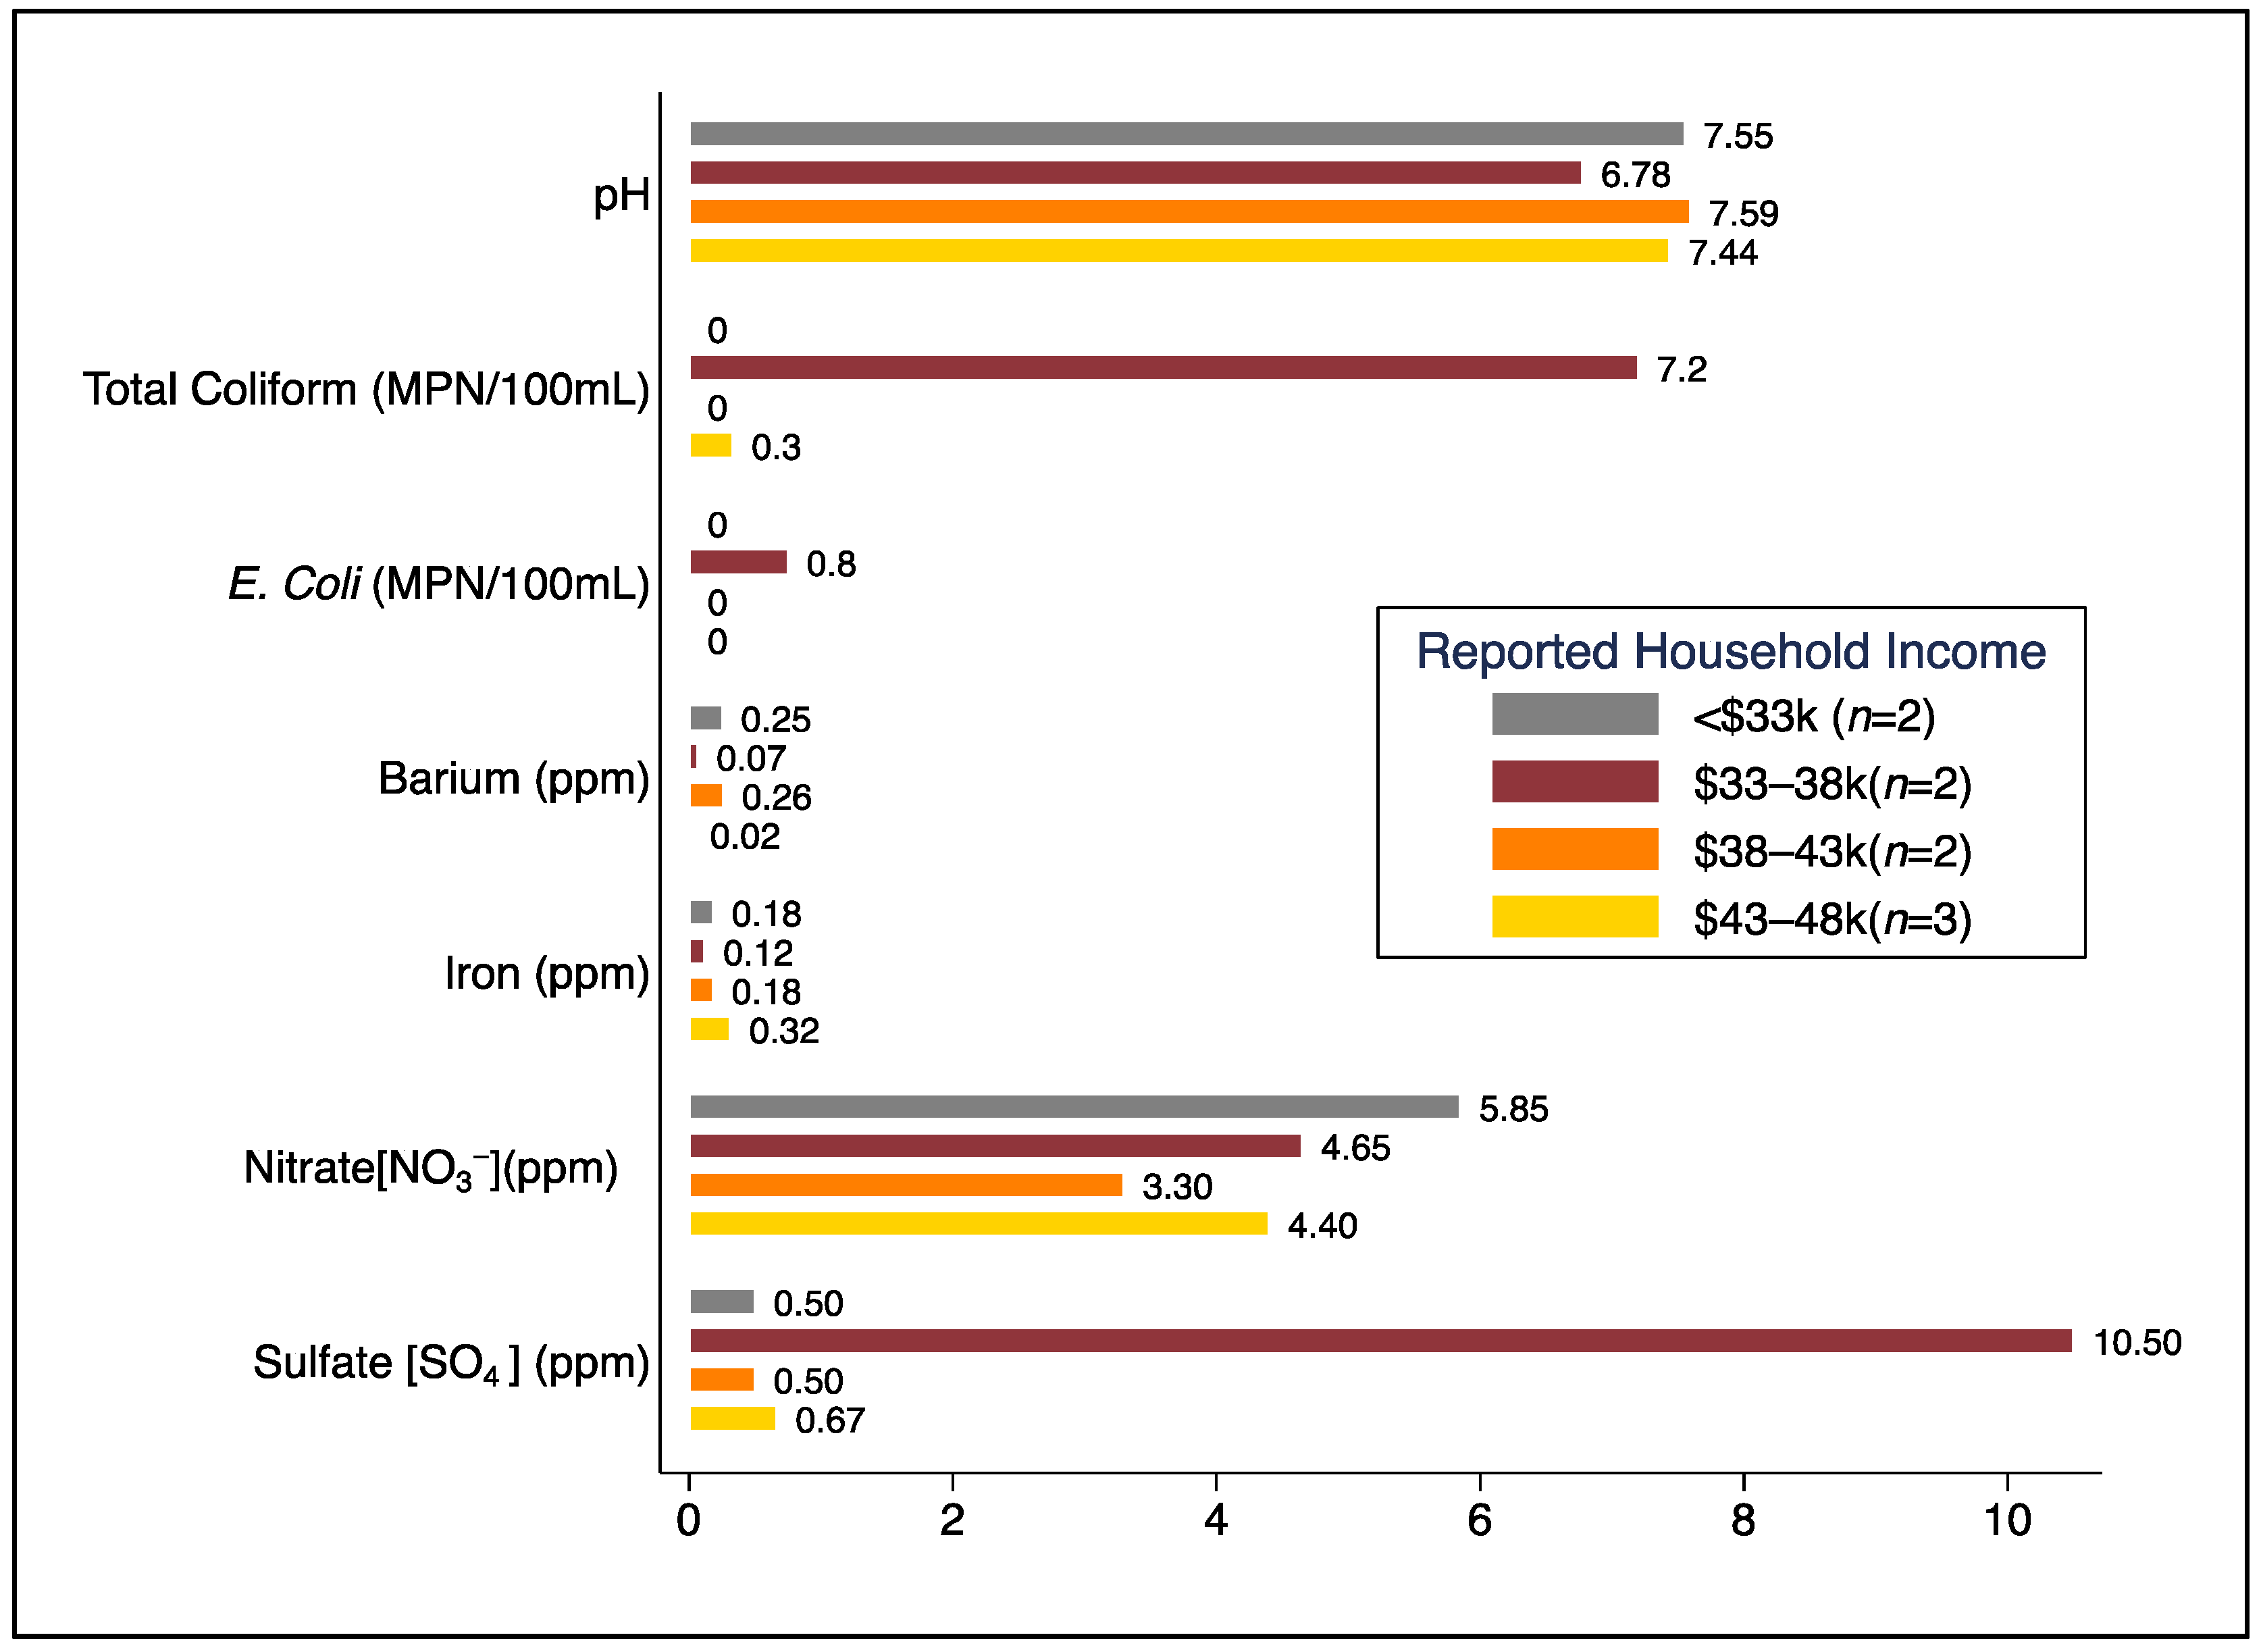
Abstract/Summary: Consumption of unsafe drinking water is associated with a substantial burden of disease globally. In the US, ~1.8 million people in rural areas lack reliable access to safe drinking water. Our objective was to characterize and assess household-level water sources, water quality, and associated health outcomes in Central Appalachia. We collected survey data and water samples (tap, source, and bottled water) from consenting households in a small rural community without utility-supplied water in southwest Virginia. Water samples were analyzed for physicochemical parameters, total coliforms, E. coli, nitrate, sulfate, metals (e.g., arsenic, cadmium, lead), and 30+ enteric pathogens. Among the 69% (n = 9) of households that participated, all had piped well water, though 67% (n = 6) used bottled water as their primary drinking water source. Total coliforms were detected in water samples from 44.4% (n = 4) of homes, E. coli in one home, and enteric pathogens (Aeromonas, Campylobacter, Enterobacter) in 33% (n = 3) of homes. Tap water samples from 11% (n = 1) of homes exceeded the EPA MCL for nitrate, and 33% (n = 3) exceeded the EPA SMCL for iron. Among the 19 individuals residing in study households, reported diarrhea was 25% more likely in homes with measured E. coli and/or specific pathogens (risk ratio = 1.25, cluster-robust standard error = 1.64, p = 0.865). Although our sample size was small, our findings suggest that a considerable number of lower-income residents without utility-supplied water in rural areas of southwest Virginia may be exposed to microbiological and/or chemical contaminants in their water, and many, if not most, rely on bottled water as their primary source of drinking water.

Subsewershed SARS-CoV-2 Wastewater Surveillance & COVID-19 Epidemiology Using Building-specific Occupancy & Case Data

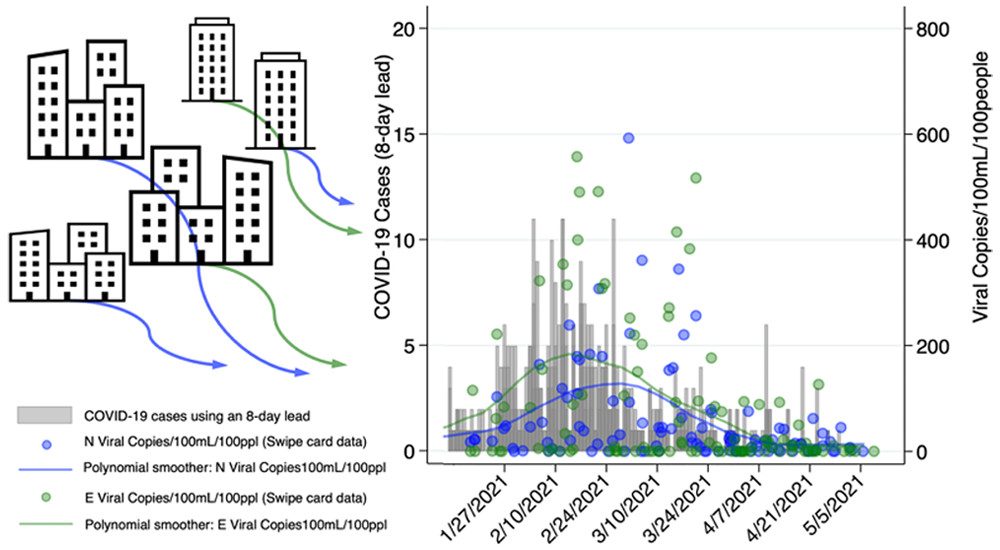
Abstract/Summary: To evaluate the use of wastewater-based surveillance and epidemiology to monitor and predict SARS-CoV-2 virus trends, over the 2020–2021 academic year we collected wastewater samples twice weekly from 17 manholes across Virginia Tech’s main campus. We used data from external door swipe card readers and student isolation/quarantine status to estimate building-specific occupancy and COVID-19 case counts at a daily resolution. After analyzing 673 wastewater samples using reverse transcription quantitative polymerase chain reaction (RT-qPCR), we reanalyzed 329 samples from isolation and nonisolation dormitories and the campus sewage outflow using reverse transcription digital droplet polymerase chain reaction (RT-ddPCR). Population-adjusted viral copy means from isolation dormitory wastewater were 48% and 66% higher than unadjusted viral copy means for N and E genes (1846/100 mL to 2733/100 mL/100 people and 2312/100 mL to 3828/100 mL/100 people, respectively; n = 46). Prespecified analyses with random-effects Poisson regression and dormitory/cluster-robust standard errors showed that the detection of N and E genes were associated with increases of 85% and 99% in the likelihood of COVID-19 cases 8 days later (incident–rate ratio (IRR) = 1.845, p = 0.013 and IRR = 1.994, p = 0.007, respectively; n = 215), and one-log increases in swipe card normalized viral copies (copies/100 mL/100 people) for N and E were associated with increases of 21% and 27% in the likelihood of observing COVID-19 cases 8 days following sample collection (IRR = 1.206, p < 0.001, n = 211 for N; IRR = 1.265, p < 0.001, n = 211 for E). One-log increases in swipe normalized copies were also associated with 40% and 43% increases in the likelihood of observing COVID-19 cases 5 days after sample collection (IRR = 1.403, p = 0.002, n = 212 for N; IRR = 1.426, p < 0.001, n = 212 for E). Our findings highlight the use of building-specific occupancy data and add to the evidence for the potential of wastewater-based epidemiology to predict COVID-19 trends at subsewershed scales.