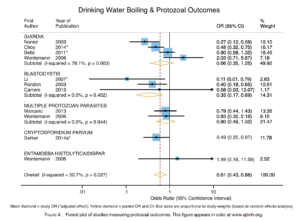
 Abstract/Summary: Globally, approximately 2 billion people lack microbiologically safe drinking water. Boiling is the most prevalent household water treatment method, yet evidence of its health impact is limited. To conduct this systematic review, we searched four online databases with no limitations on language or publication date. Studies were eligible if health outcomes were measured for participants who reported consuming boiled and untreated water. We used reported and calculated odds ratios (ORs) and random-effects meta-analysis to estimate pathogen-specific and pooled effects by organism group and nonspecific diarrhea. Heterogeneity and publication bias were assessed using I2, meta-regression, and funnel plots; study quality was also assessed. Of the 1,998 records identified, 27 met inclusion criteria and reported extractable data. We found evidence of a significant protective effect of boiling for Vibrio cholerae infections (OR = 0.31, 95% confidence interval [CI] = 0.13–0.79, N = 4 studies), Blastocystis (OR = 0.35, 95% CI = 0.17–0.69, N = 3), protozoal infections overall (pooled OR = 0.61, 95% CI = 0.43–0.86, N = 11), viral infections overall (pooled OR = 0.83, 95% CI =0.7–0.98, N = 4), and nonspecific diarrheal outcomes (OR = 0.58, 95% CI = 0.45–0.77, N = 7). We found no evidence of a protective effect for helminthic infections. Although our study was limited by the use of self-reported boiling and non-experimental designs, the evidence suggests that boiling provides measurable health benefits for pathogens whose transmission routes are primarily water based. Consequently, we believe a randomized controlled trial of boiling adherence and health outcomes is needed.

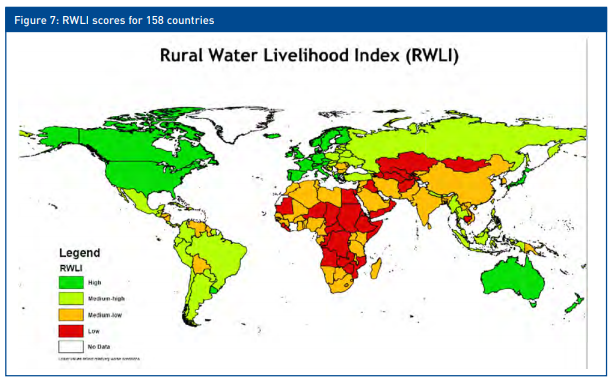
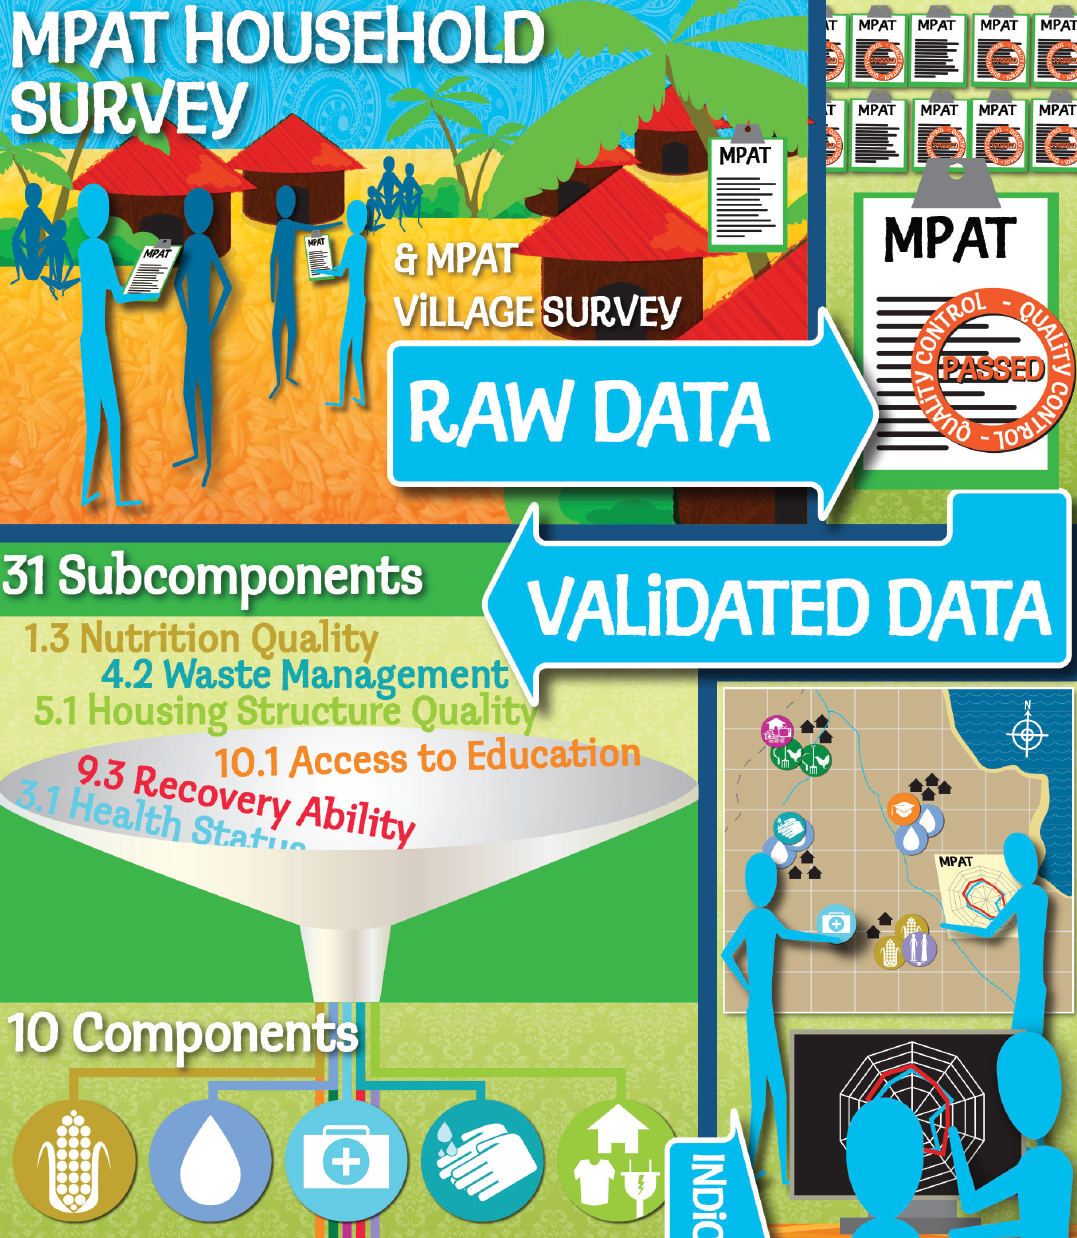
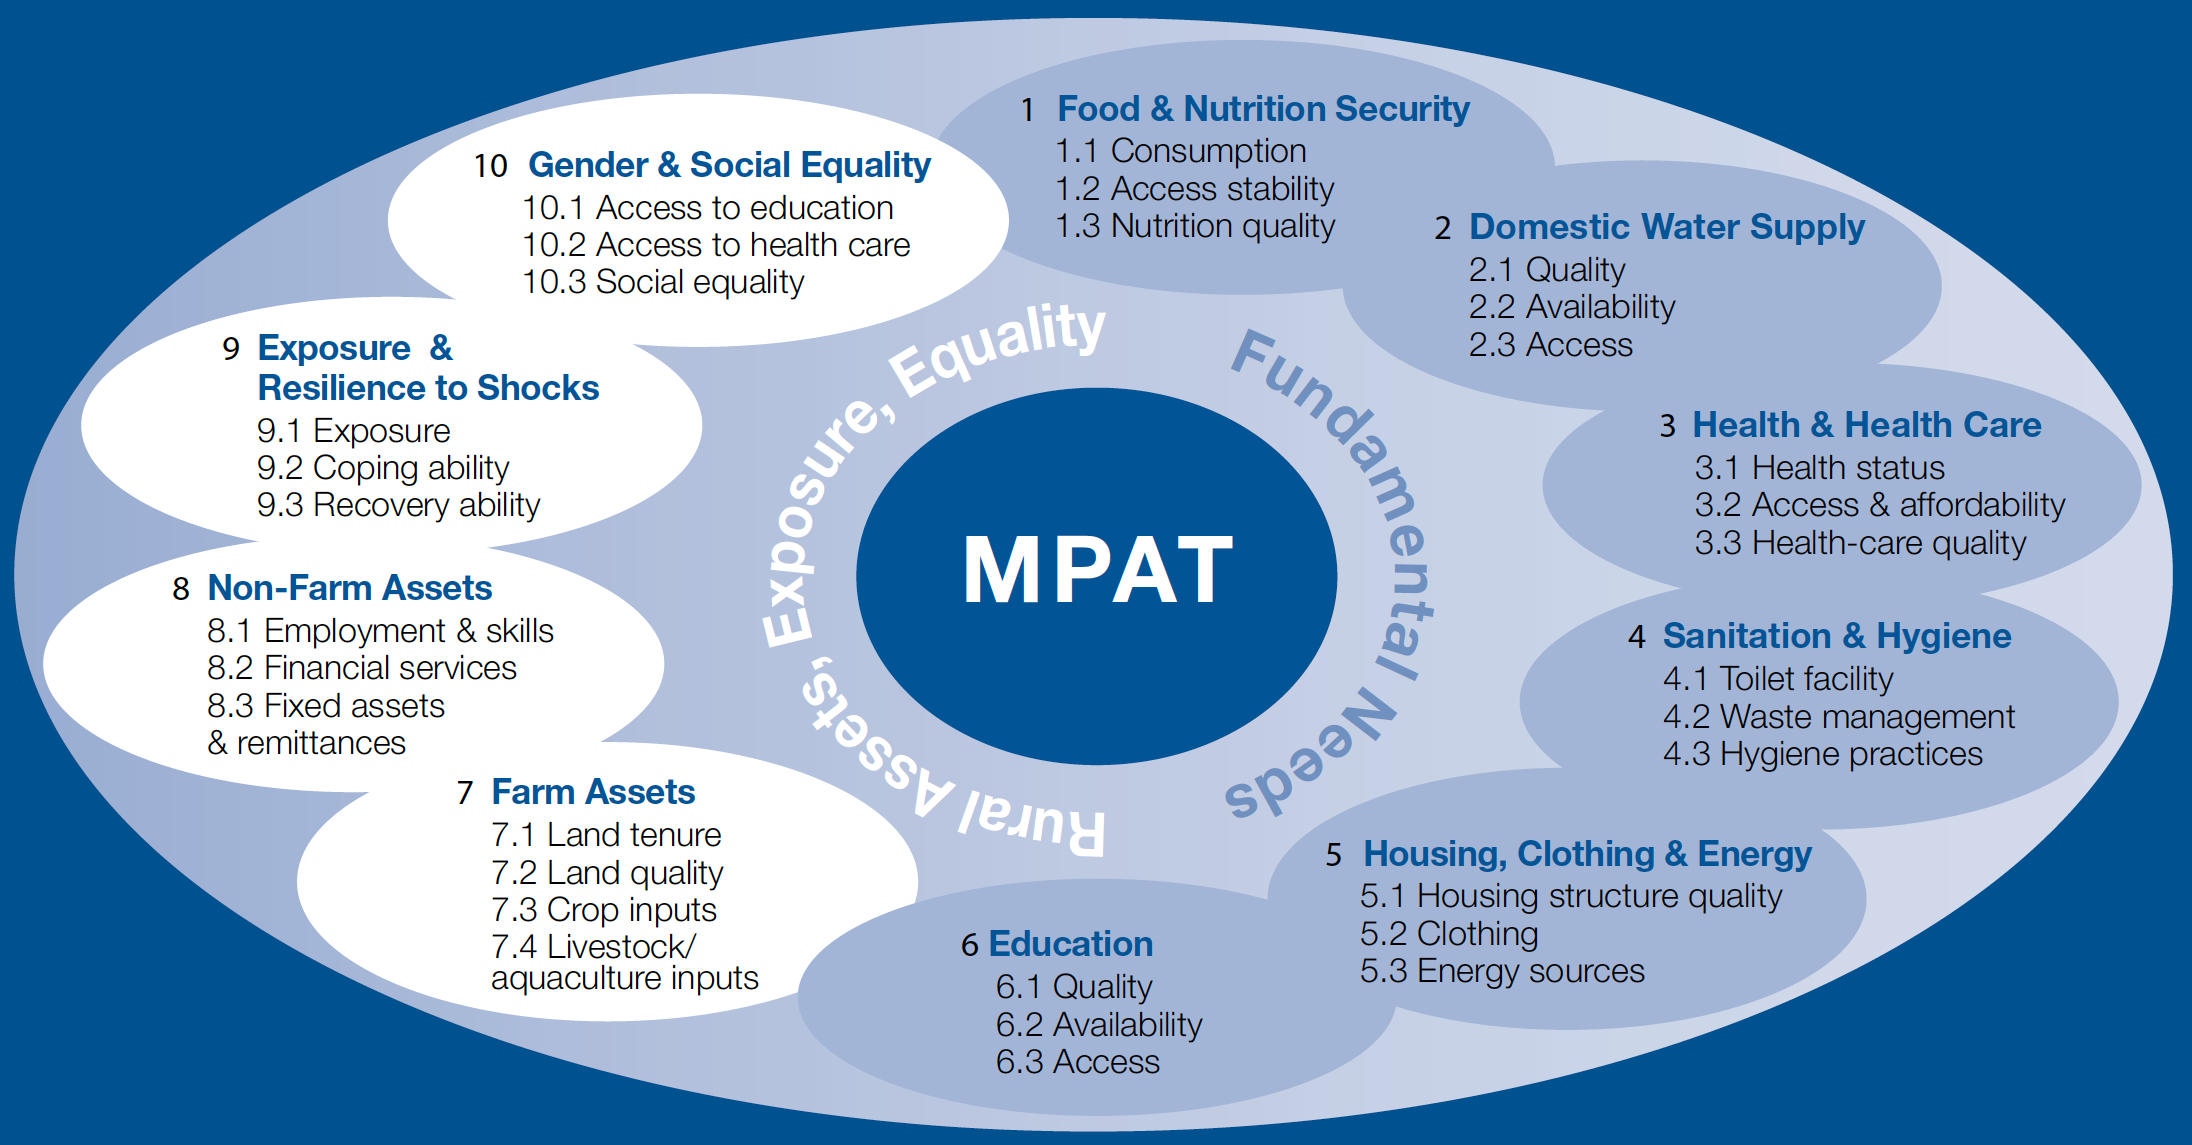
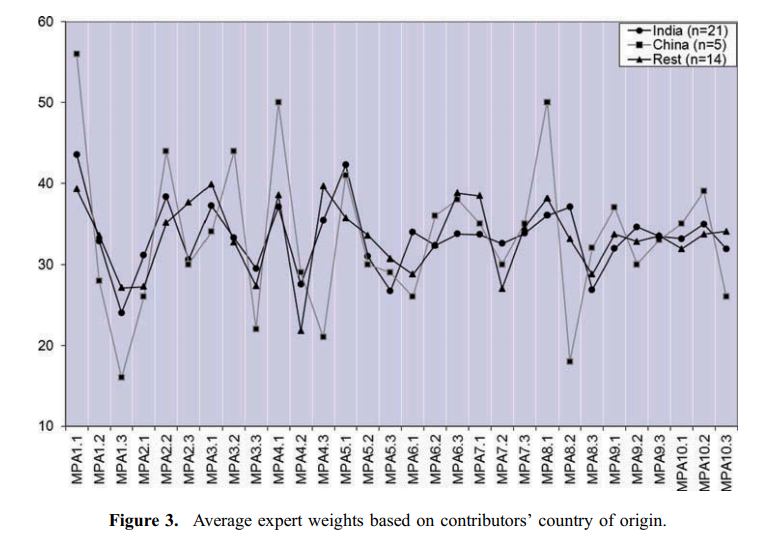 Abstract/Summary: This article discusses the participatory creation of the Multidimensional Poverty Assessment Tool (MPAT), a survey-based thematic indicator developed in China and India. The core of the article focuses on the use of expert elicitation to inform the construction of MPAT’s household and village surveys, the cardinalisation of survey responses, and the weighting scheme design. This is followed by a discussion of the potential pitfalls of expertise in development, the decision not to aggregate MPAT into an index, creating locally relevant poverty lines, and ideas for future research. The article closes with a summary of lessons learned.