
Subsewershed analyses of the impacts of inflow and infiltration on viral pathogens and antibiotic resistance markers across a rural sewer system
Authors: Darling, A., Davis, B., Byrne, T., Deck, M., Rivera, G., Price, S., Amaral-Torres, A., Markham, C., Gonzalez, R., Vikesland, P., Krometis, L.-A., Pruden, A., & Cohen, A.*
Publication Year: 2025 | Journal / Publisher: Water Research
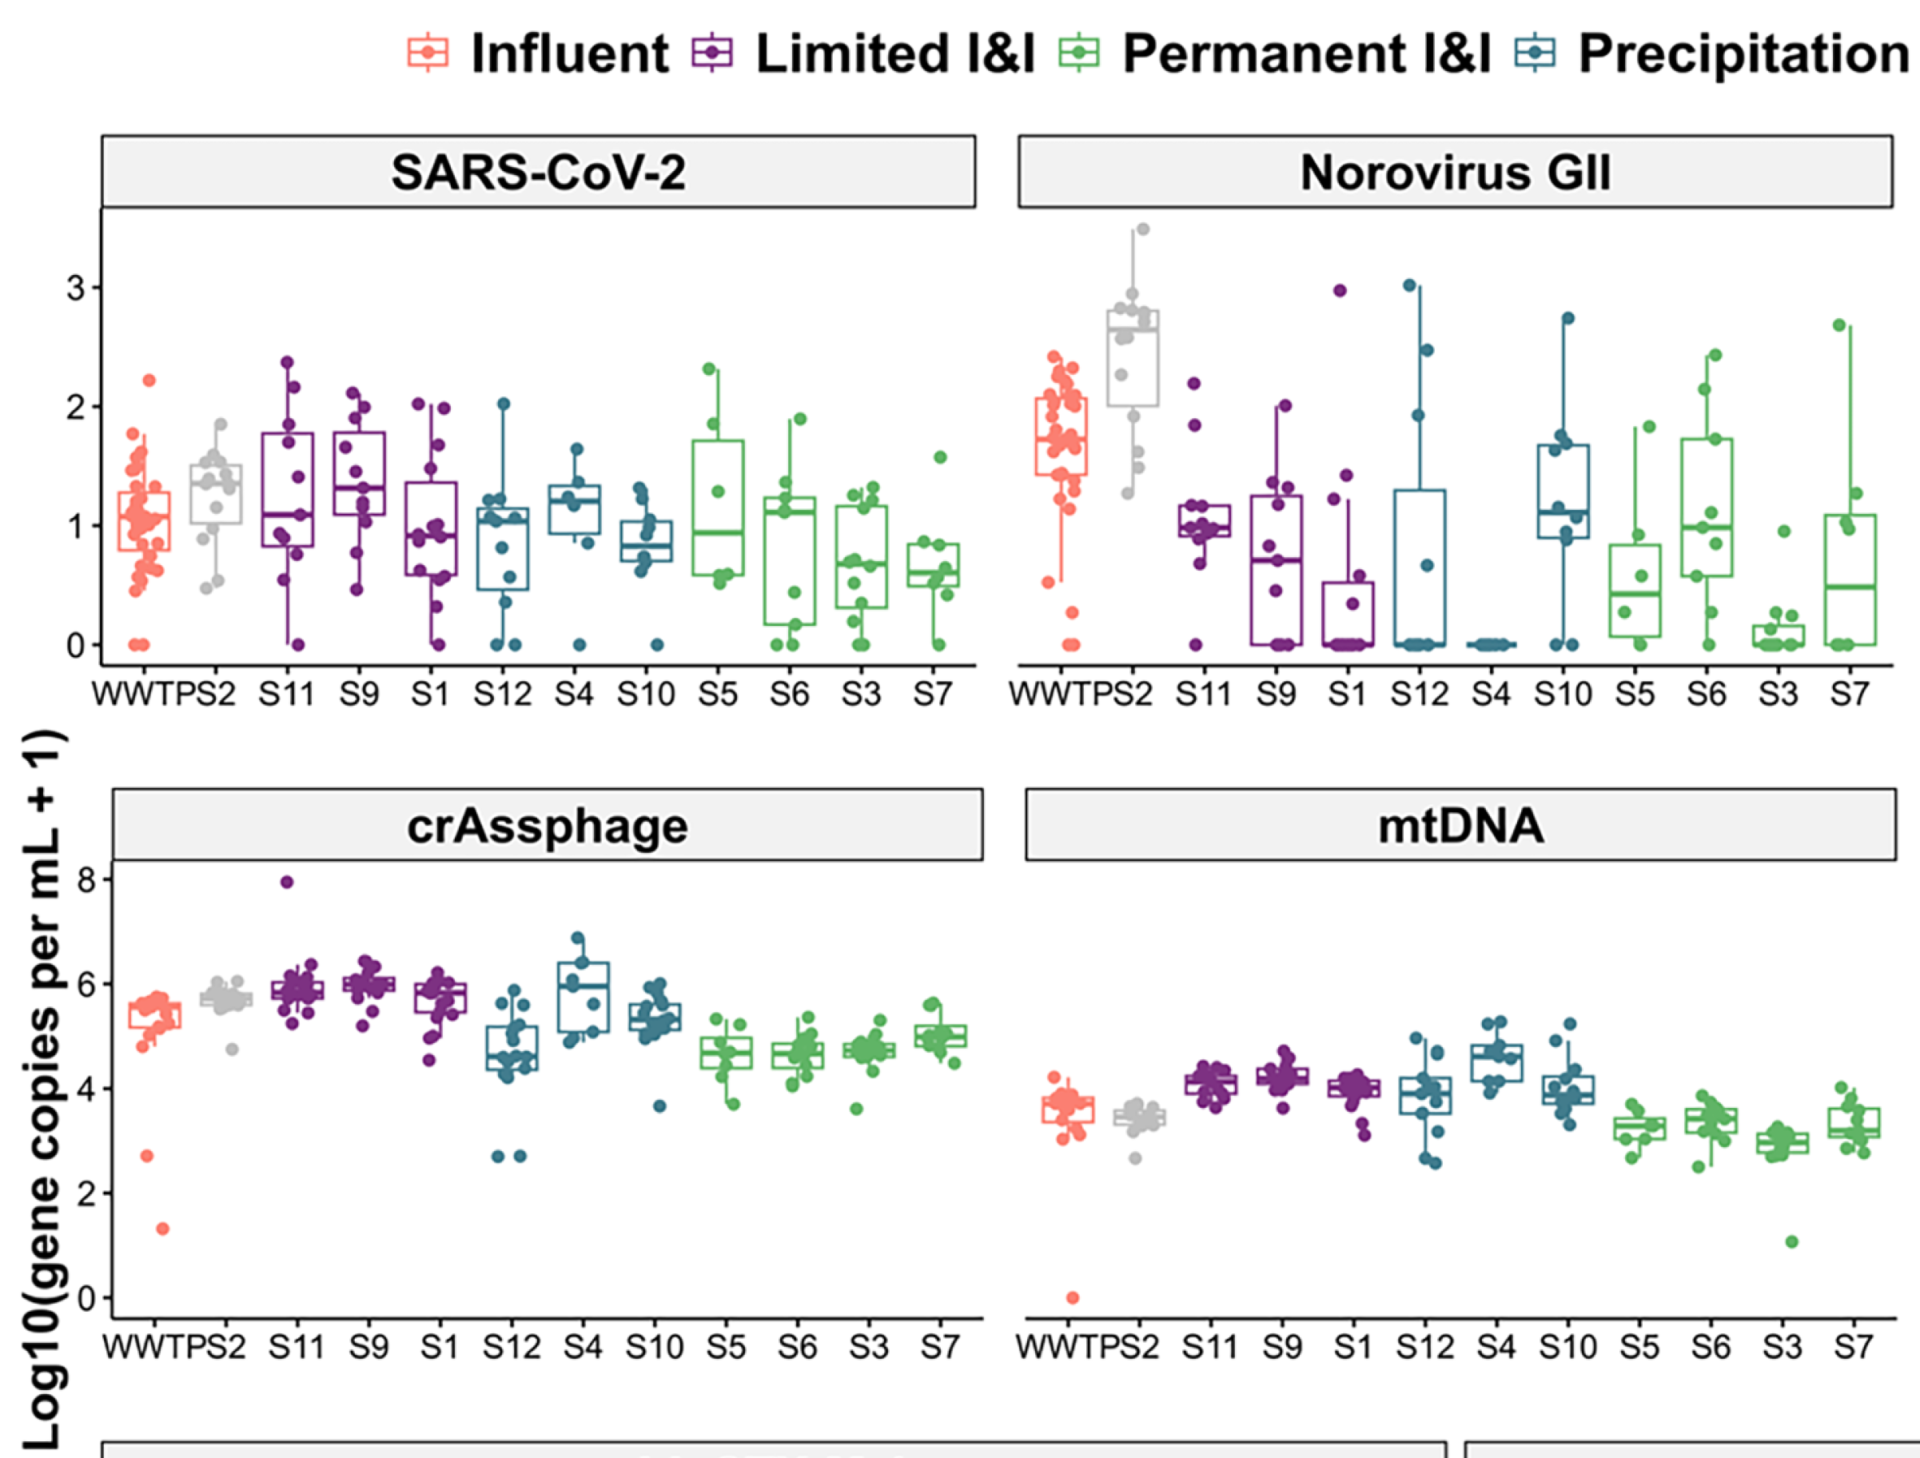
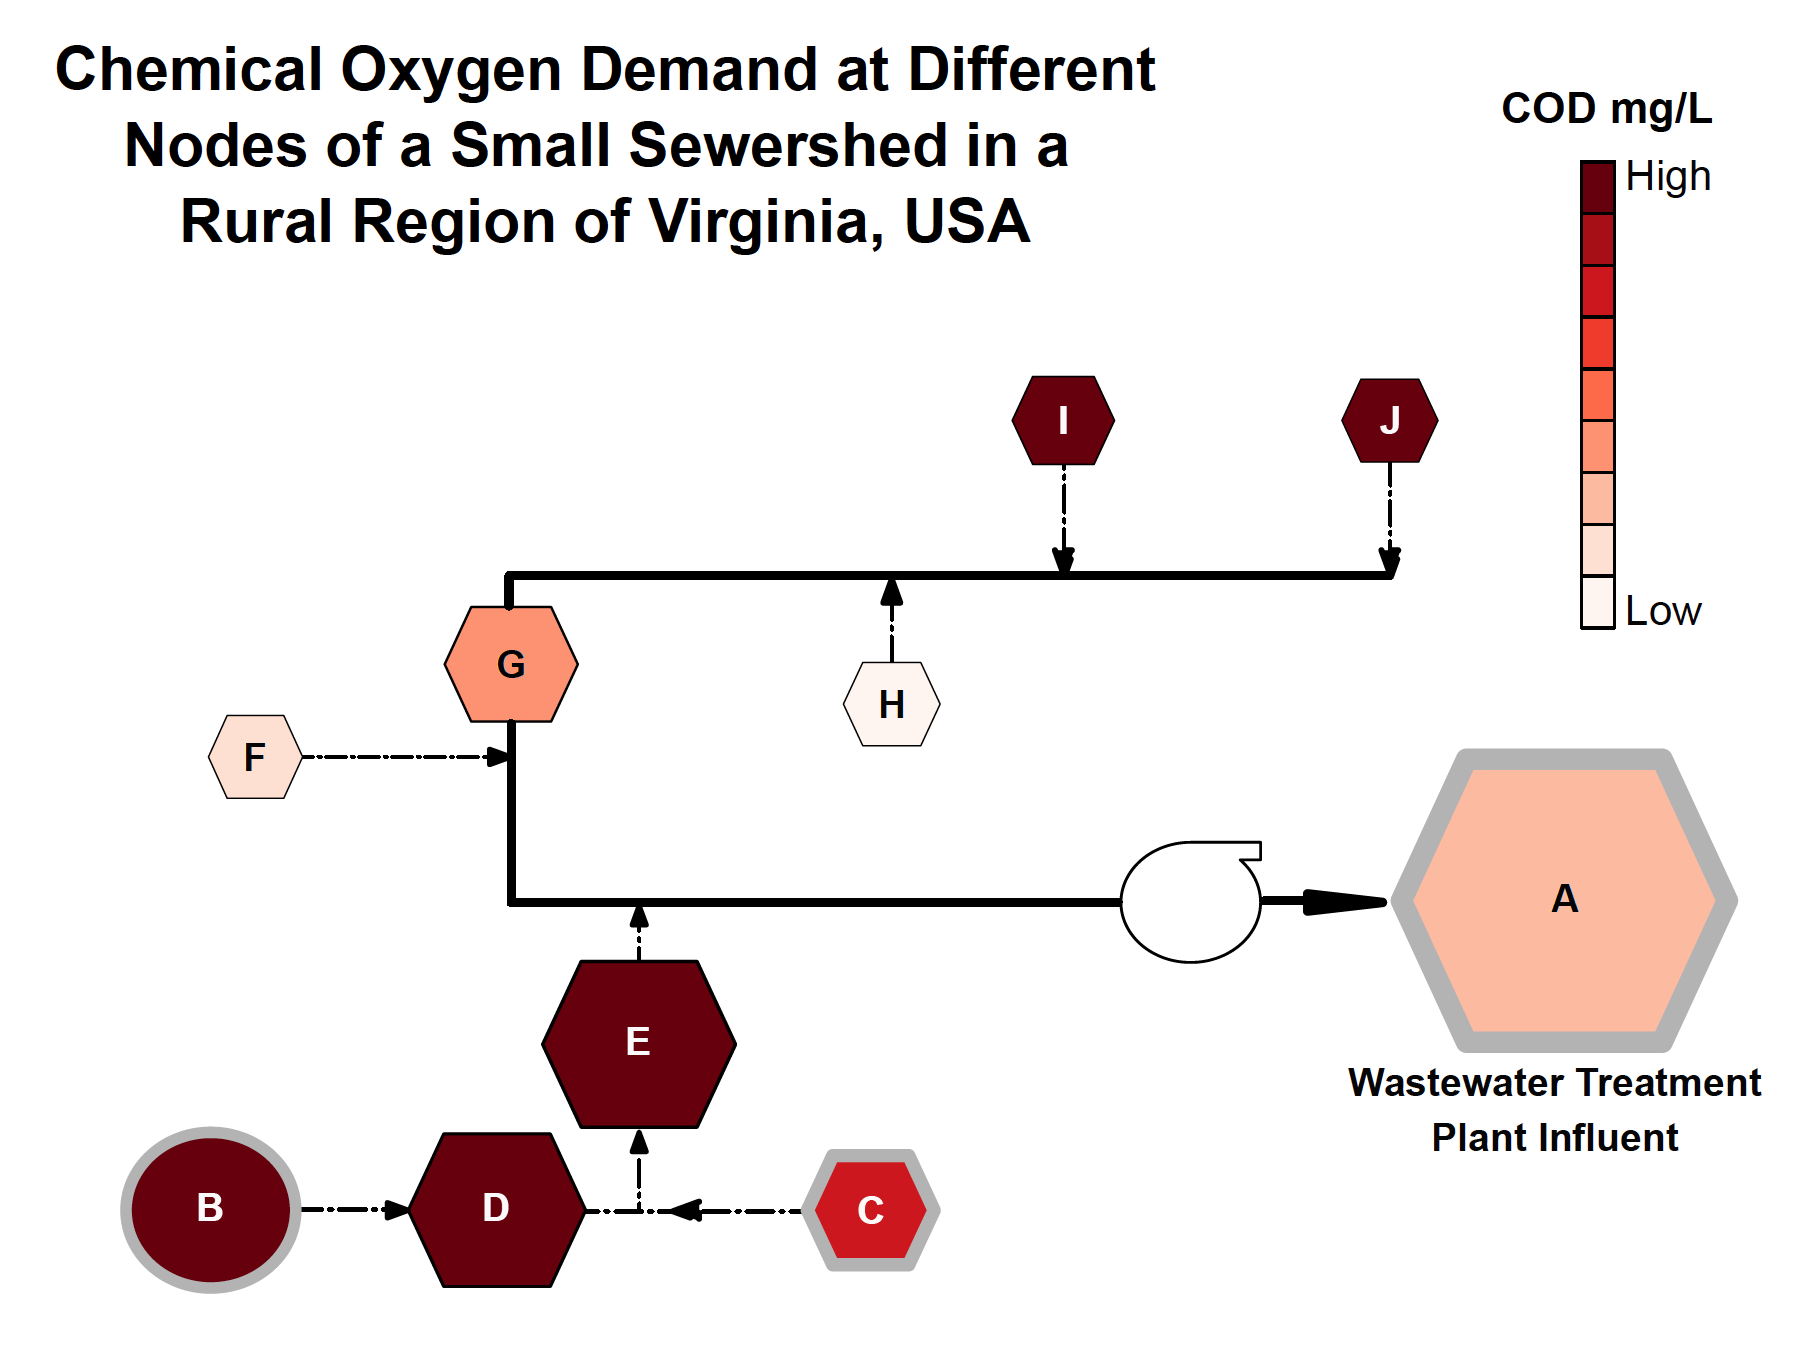
Abstract/Summary: As wastewater-based surveillance (WBS) is increasingly used to track community-level disease trends, it is important to understand how pathogen signals can be altered by phenomena that occur within sewersheds such as inflow and infiltration (I&I). Our objectives were to characterize I&I across a rural sewershed and assess potential impacts on viral (rotavirus, norovirus GII, and SARS-CoV-2), fecal indicator (HF183, the hCYTB484 gene specific to the human mitochondrial genome, and crAssphage), and antimicrobial resistance (intI1, blaCTX−M-1) targets. In a small town in Virginia (USA), we collected 107 wastewater samples at monthly intervals over a 12-month period (2022–2023) at the wastewater treatment plant (WWTP) influent and 11 up-sewer sites. Viral, fecal indicator, and antimicrobial resistance targets were enumerated using ddPCR. We observed the highest concentrations of human fecal markers and a measure anthropogenic pollution and antibiotic resistance (intI1) in up-sewer sites with limited I&I. However, median viral gene copy concentrations were highest at the WWTP, compared to 100 % (n = 11), 90 % (n = 10), and 55 % (n = 6) of up-sewer sites for rotavirus, norovirus GII, and SARS-CoV-2, respectively. After adjusting for covariates (Ba, COD, dissolved oxygen, groundwater depth, precipitation, sampling date) using generalized linear models, moderate to high I&I was associated with statistically significant reductions in log10-transformed rotavirus and norovirus GII concentrations across the sewershed (coefficients = -0.7 and -0.9, p < 0.001, n = 95), though not for SARS-CoV-2 (coefficient = -0.2, p = 0.181, n = 95). Overall, we found that while I&I can diminish biomarker signals throughout a sewershed, including at the WWTP influent, I&I impacts vary depending on the target, and pathogen biomarker signals were, on average, higher and less variable over time at the WWTP compared to most up-sewer sites. As far as we are aware, this is the first study to assess in situ I&I impacts on multiple WBS targets. Taken together, our findings highlight challenges and tradeoffs associated with different sampling strategies for different WBS targets in heavily I&I impacted systems.
PDF on Publisher Website | PDF on OSF
Drinking water sources, quality, and associated health outcomes in Appalachian Virginia: A risk characterization study in two counties
Authors: Cohen*, Rasheduzzaman, O’Connell, Brown, Taniuchi, Krometis, Hubbard, Scheuerman, Edwards, Darling, Pennala, Price, Lytton, Wettstone, Pholwat, Ward, Hallinger, Simmons, Griffin, Kobylanski, Egorov, & Wade
Publication Year: 2024 | Journal / Publisher: International Journal of Hygiene and Environmental Health
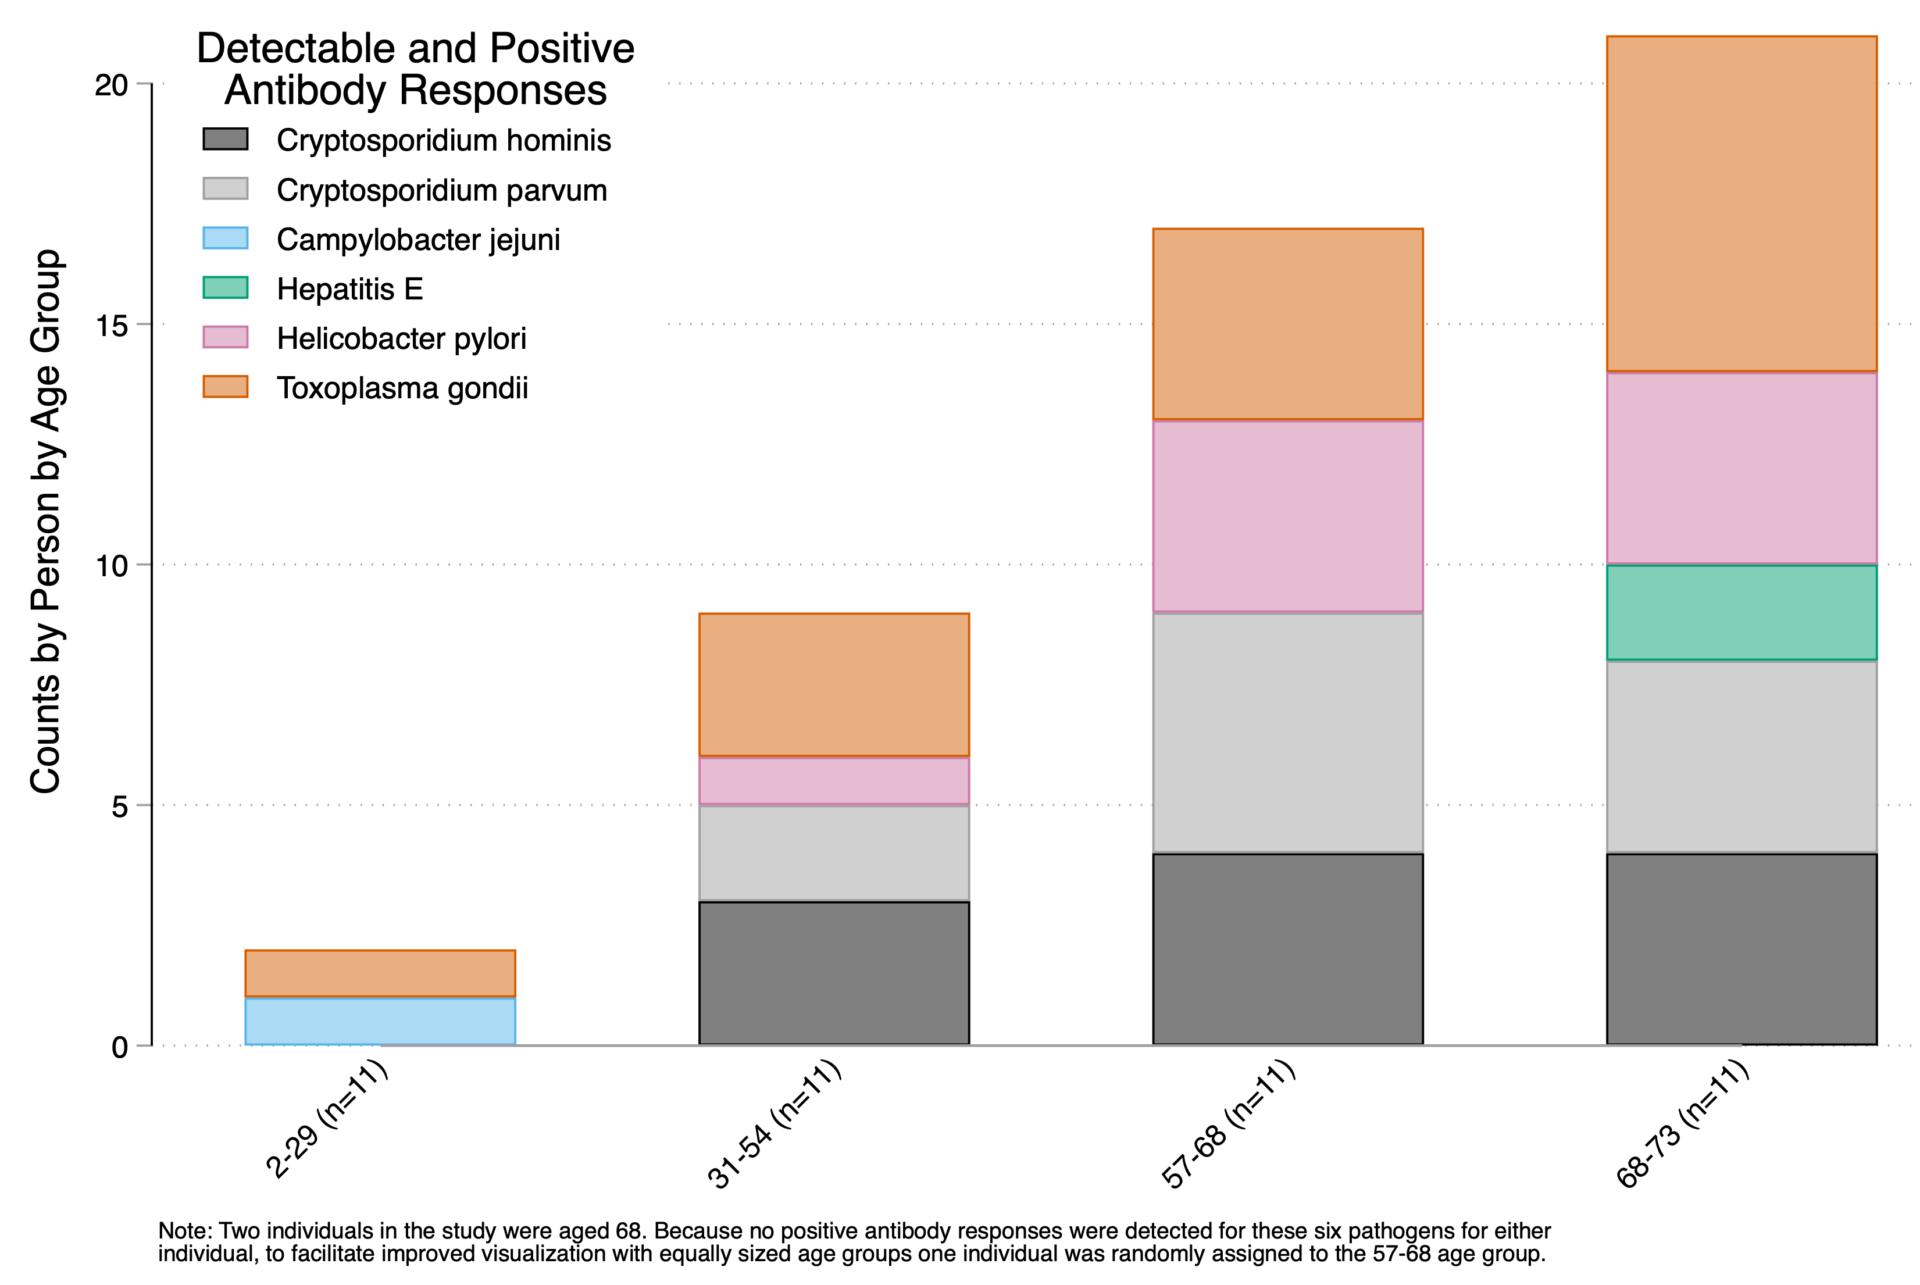
Abstract/Summary: In the US, violations of drinking water regulations are highest in lower-income rural areas overall, and particularly in Central Appalachia. However, data on drinking water use, quality, and associated health outcomes in rural Appalachia are limited. We sought to assess public and private drinking water sources and associated risk factors for waterborne pathogen exposures for individuals living in rural regions of Appalachian Virginia. We administered surveys and collected tap water, bottled water, and saliva samples in lower-income households in two adjacent rural counties in southwest Virginia (bordering Kentucky and Tennessee). Water samples were tested for pH, temperature, conductivity, total coliforms, E. coli, free chlorine, nitrate, fluoride, heavy metals, and specific pathogen targets. Saliva samples were analyzed for antibody responses to potentially waterborne infections. We also shared water analysis results with households. We enrolled 33 households (83 individuals), 82% (n = 27) with utility-supplied water and 18% with private wells (n = 3) or springs (n = 3). 58% (n = 19) reported household incomes of <$20,000/year. Total coliforms were detected in water samples from 33% (n = 11) of homes, E. coli in 12%, all with wells or springs (n = 4), and Aeromonas, Campylobacter, and Enterobacter in 9%, all spring water (n = 3). Diarrhea was reported for 10% of individuals (n = 8), but was not associated with E. coli detection. 34% (n = 15) of saliva samples had detectable antibody responses for Cryptosporidium spp., C. jejuni, and Hepatitis E. After controlling for covariates and clustering, individuals in households with septic systems and straight pipes had significantly higher likelihoods of antibody detection (risk ratios = 3.28, 95%CI = 1.01–10.65). To our knowledge, this is the first study to collect and analyze drinking water samples, saliva samples, and reported health outcome data from low-income households in Central Appalachia. Our findings indicate that utility-supplied water in this region was generally safe, and individuals in low-income households without utility-supplied water or sewerage have higher exposures to waterborne pathogens.
PDF on Publisher Website | PDF on OSF
Making Waves: The Benefits and Challenges of Responsibly Implementing Wastewater-based Surveillance for Rural Communities
Authors: Cohen, A., Vikesland, P., Pruden, A., Krometis, L.-A., Lee, L.M., Darling, A., Yancey, M., Helmick, M., Singh, R., Gonzalez, R., Meit, M., Degen, M., & Taniuchi, M.
Publication Year: 2023 | Journal / Publisher: Water Research
Abstract/Summary: The sampling and analysis of sewage for pathogens and other biomarkers offers a powerful tool for monitoring and understanding community health trends and potentially predicting disease outbreaks. Since the early months of the COVID-19 pandemic, the use of wastewater-based testing for public health surveillance has increased markedly. However, these efforts have focused on urban and peri-urban areas. The potential public health benefits of wastewater-based surveillance for rural communities are substantial – though so too are the methodological and ethical challenges. Practitioner observations and research findings indicate that for many rural systems, typical implementation approaches for wastewater-based surveillance will not yield sufficiently reliable or actionable results. In this paper, we discuss key challenges and potential strategies to address them. However, to support and expand the implementation of responsible, reliable, and ethical wastewater-based surveillance for rural communities, best practice guidelines and standards are needed.
PDF on Publisher Website | PDF on OSF
Subsewershed SARS-CoV-2 Wastewater Surveillance & COVID-19 Epidemiology Using Building-specific Occupancy & Case Data
Authors: Cohen, A.,Maile-Moskowitz, A., Grubb, C., Gonzalez, R. A., Ceci, A., Darling, A., Hungerford, L., Fricker, R. D., Finkielstein, C. V., Pruden, A., & Vikesland, P. J.
Publication Year: 2022 | Journal / Publisher: Environmental Science & Technology - Water
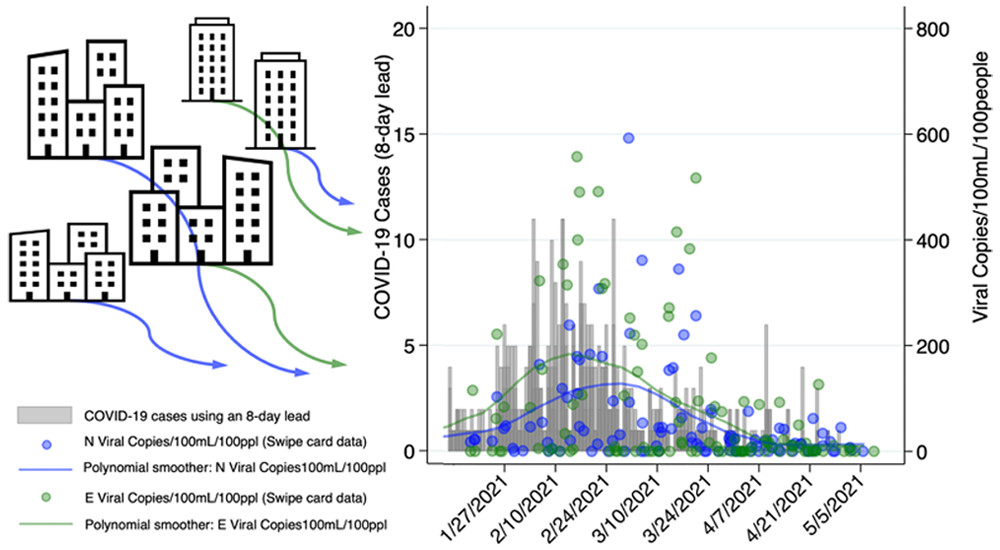
Abstract/Summary: To evaluate the use of wastewater-based surveillance and epidemiology to monitor and predict SARS-CoV-2 virus trends, over the 2020–2021 academic year we collected wastewater samples twice weekly from 17 manholes across Virginia Tech’s main campus. We used data from external door swipe card readers and student isolation/quarantine status to estimate building-specific occupancy and COVID-19 case counts at a daily resolution. After analyzing 673 wastewater samples using reverse transcription quantitative polymerase chain reaction (RT-qPCR), we reanalyzed 329 samples from isolation and nonisolation dormitories and the campus sewage outflow using reverse transcription digital droplet polymerase chain reaction (RT-ddPCR). Population-adjusted viral copy means from isolation dormitory wastewater were 48% and 66% higher than unadjusted viral copy means for N and E genes (1846/100 mL to 2733/100 mL/100 people and 2312/100 mL to 3828/100 mL/100 people, respectively; n = 46). Prespecified analyses with random-effects Poisson regression and dormitory/cluster-robust standard errors showed that the detection of N and E genes were associated with increases of 85% and 99% in the likelihood of COVID-19 cases 8 days later (incident–rate ratio (IRR) = 1.845, p = 0.013 and IRR = 1.994, p = 0.007, respectively; n = 215), and one-log increases in swipe card normalized viral copies (copies/100 mL/100 people) for N and E were associated with increases of 21% and 27% in the likelihood of observing COVID-19 cases 8 days following sample collection (IRR = 1.206, p < 0.001, n = 211 for N; IRR = 1.265, p < 0.001, n = 211 for E). One-log increases in swipe normalized copies were also associated with 40% and 43% increases in the likelihood of observing COVID-19 cases 5 days after sample collection (IRR = 1.403, p = 0.002, n = 212 for N; IRR = 1.426, p < 0.001, n = 212 for E). Our findings highlight the use of building-specific occupancy data and add to the evidence for the potential of wastewater-based epidemiology to predict COVID-19 trends at subsewershed scales.
PDF on Publisher Website | PDF on OSF
The impacts of socioeconomic development on rural drinking water safety in China: A provincial-level comparative analysis
Authors: Li, H., Cohen, A., Li, Z., & Zhang, M.
Publication Year: 2019 | Journal / Publisher: Sustainability
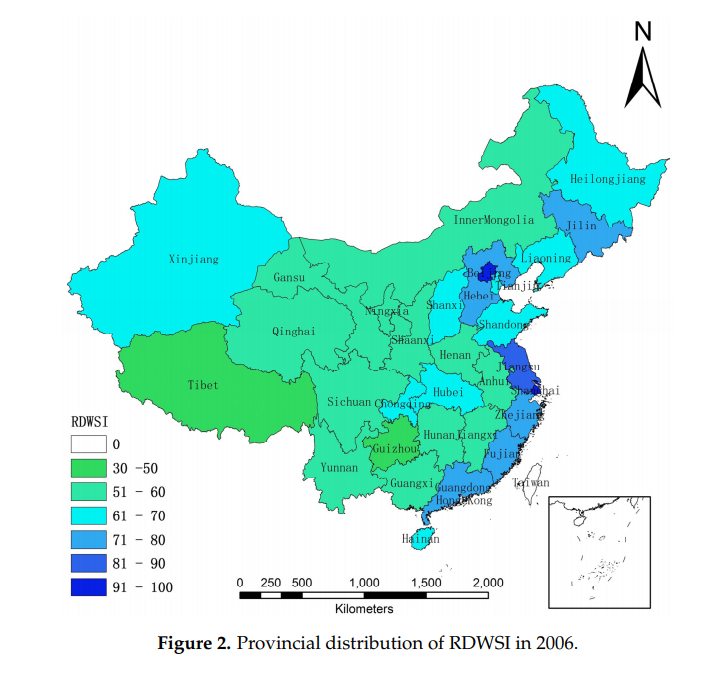 Abstract/Summary:In China, achieving rural drinking water safety—meaning access to a safe, affordable, sufficient, and sustainable drinking water supply—remains a key challenge for government agencies and researchers. Using cross-sectional data at the provincial level, in this paper we examine the impacts of socioeconomic development on drinking water safety in rural China. Using a theoretical framework called Pressure-State-Response (PSR), existing data were organized into state and pressure indicators. Canonical Correlation Analysis was then used to analyze provincial-level relationships between the indicators. Significant drinking-water-safety-related differences were found across provinces. Our analyses suggest that, overall, China’s recent and rapid socioeconomic development yielded substantial benefits for China’s rural drinking water safety. However, this same development also negatively impacted rural drinking water safety via increased groundwater over-abstraction, reductions in water supply, and environmental contamination. The paper closes with a discussion of implications and options for improving drinking water policy, management, and regulation in rural China.
PDF on Publisher Website | PDF on OSF
The Multidimensional Poverty Assessment Tool: Brochure (& Infographics)
Authors: IFAD [Cohen, A.]
Publication Year: 2014 | Journal / Publisher: United Nations International Fund for Agricultural Development
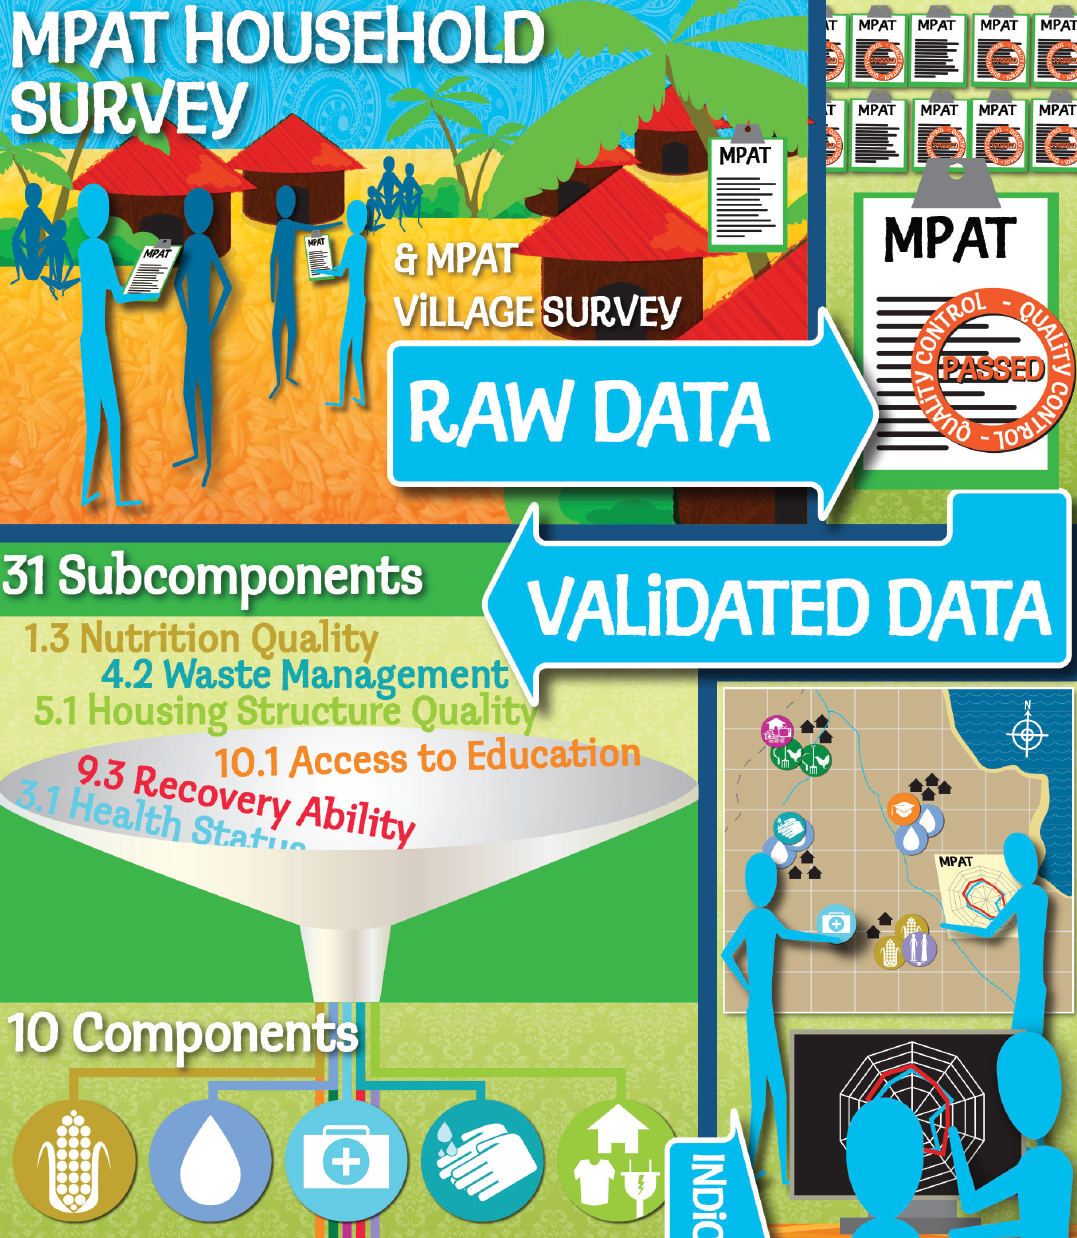 Abstract/Summary: The Multidimensional Poverty Assessment Tool (MPAT) provides data that can inform all levels of decision making by providing a clearer understanding of rural poverty at the household and village level. As a result, MPAT can significantly strengthen the planning, design, monitoring and evaluation of a project, and thereby contribute to rural poverty reduction.
This brochure explains:
-
- What MPAT is
- How MPAT works
- When to use MPAT and why
- How to use MPAT
- What resources are available for implementing MPAT
The tool allows project managers, government officials, researchers and others to identify and monitor sectors that require support in order to reduce rural poverty and improve livelihoods. It also provides an objective means of justifying resource allocation or planning priorities. MPAT is based on a bottom-up, participatory approach that reflects communities’ voices, wants and perspectives.
PDF on Publisher Website | PDF on OSF
The Multidimensional Poverty Assessment Tool: User’s Guide
Authors: IFAD [Cohen, A. & Jayne, S.]
Publication Year: 2014 | Journal / Publisher: United Nations International Fund for Agricultural Development
 Abstract/Summary: The Multidimensional Poverty Assessment Tool (MPAT) provides a method for simplifying the complexity of rural poverty in order to support poverty alleviation efforts. MPAT uses thoroughly designed and tested purpose-built surveys to collect data on people’s perceptions about fundamental and interconnected aspects of their lives, livelihoods and environments. Standardized indicators, developed through a comprehensive participatory process, are then employed to combine, distil and present these data in an accessible way. MPAT was developed through a participatory, collaborative process based on expert feedback from dozens of international development experts from IFAD, other United Nations agencies, international and regional organizations, and universities from around the world. It was field-tested in countries in both Asia and Africa. In the pages that follow, we explain what MPAT is, how it works and how it is used, providing step-by-step instructions, training materials and other resources. The ultimate objective of this User’s Guide and the accompanying Excel Spreadsheet is to make MPAT a truly free and open-source tool, so that any institution or agency, big or small, may implement MPAT on its own.
PDF on Publisher Website | PDF on OSF
The Multidimensional Poverty Assessment Tool: Design, development & application of a new framework for measuring rural poverty
Authors: Cohen, A.
Publication Year: 2009 | Journal / Publisher: United Nations International Fund for Agricultural Development
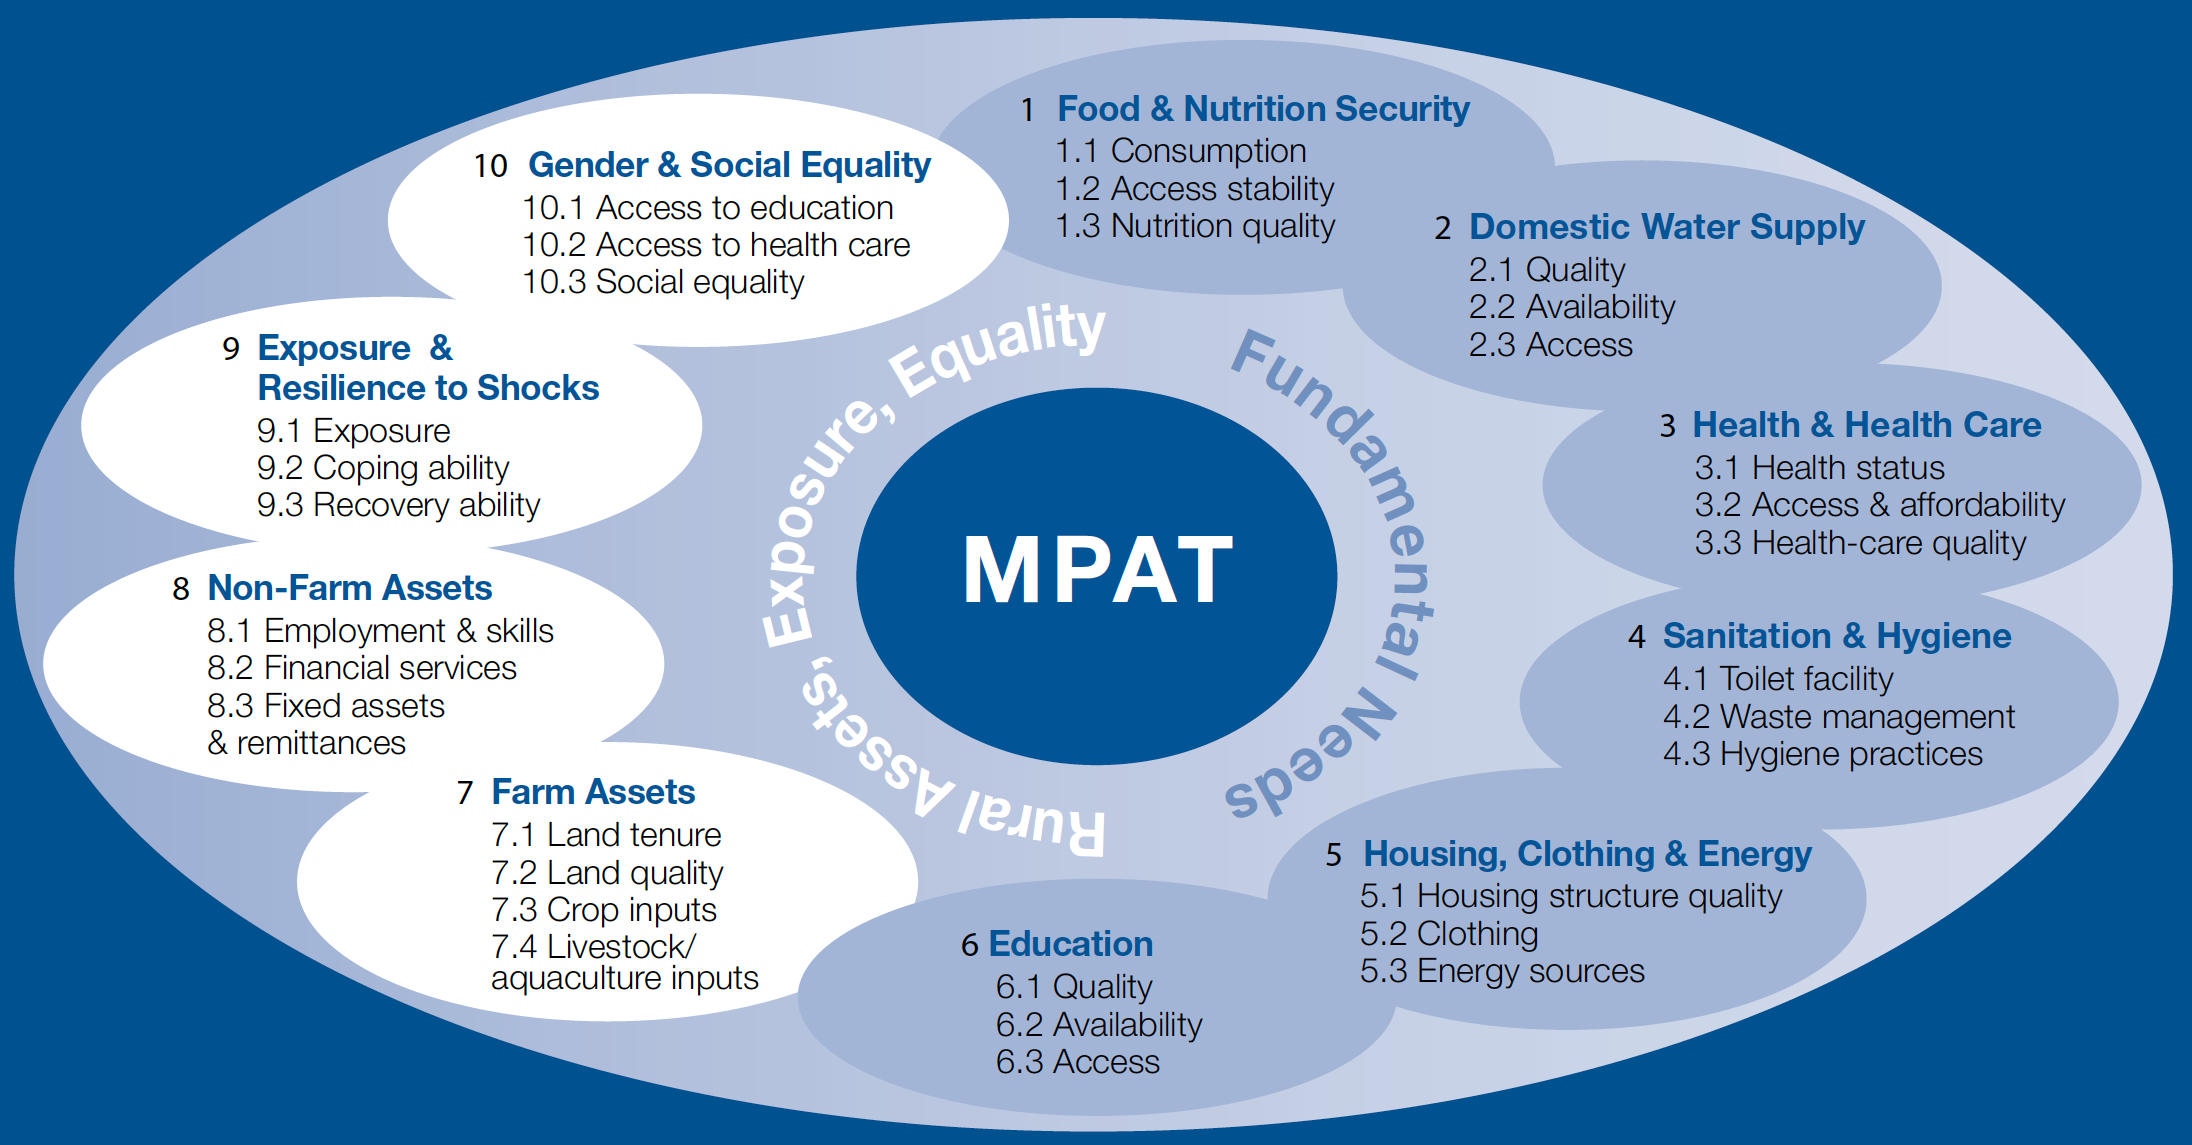 Abstract/Summary: The purpose of this book is to describe the theoretical foundations upon which the Multidimensional Poverty Assessment Tool (MPAT) was built, to tell the story of how it was created, developed, tested and piloted in rural China and India, and to explain how MPAT can be used to benefit rural communities around the world. Lasting poverty alleviation is achieved by fostering a comprehensive enabling environment within which people have a sufficiently high level of well-being and are able to pursue their livelihood goals based on their aspirations and initiative. To ensure that such environments are in place requires, at a minimum, an understanding of the key constraints rural people face – the fundamental dimensions central to their lives and livelihoods. MPAT does not try to define rural poverty per se; rather it takes a step back from assessment modalities that are overly focused on economic- and consumption-oriented indicators and strives to provide an overview of fundamental and relatively universal dimensions germane to rural livelihoods, rural life, and thus to rural poverty. By summarizing rural communities’ perceptions about key dimensions of rural poverty and focusing them through a quantitative lens, MPAT transparently illuminates problem areas so that all stakeholders can see where deficiencies lie and can begin to discuss which interventions may be most appropriate to address them, based on the local context.
PDF on Publisher Website | PDF on OSF